Customer Logins
Obtain the data you need to make the most informed decisions by accessing our extensive portfolio of information, analytics, and expertise. Sign in to the product or service center of your choice.
Customer Logins
EQUITIES COMMENTARY
Jun 22, 2016
Hedging for Brexit and 'black swans'
Investors concerned with limiting downside risk to unforeseen (and foreseen) market events can potentially enhance performance by avoiding stocks shown to fall during similar past events, and by picking stocks historically known for subsequent market bounces.
- Isolating and avoiding low ranked quality names creates inexpensive pseudo-hedges
- Volatility and valuation rankings enhance returns, both in avoidance and in stock selection
- Post market events, Deep Value factors lead returns as markets bounce back
Ahead of the UK's vote on continued membership to the European Union, expected to have a large impact on markets, Markit Research Signals has released a detailed report analysing how long investors can best position portfolios to outperform during and post major market moving events - whether anticipated or not.
Pleasecontact us to get the full report.
Unanticipated market downturns have historically occurred more frequently than expected and are associated with higher levels of volatility. However investors can avoid names that are expected to fall the most while also going long names expected to subsequently outperform.
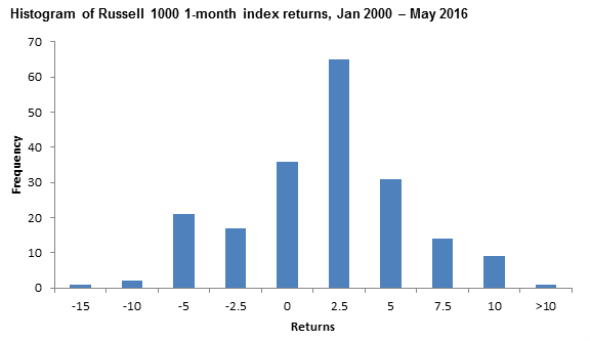
One month price changes across the Russell 1000 from January 2000 to May 2016 show that large drawdowns (exceeding 2%) occur more than is actually expected by a normal distribution - with 47 occurrences during the time frame. Market sell offs are more frequent than anticipated and when markets do sell off, volatility levels increase, as shown by the relationship in the chart below where volatility decreases when markets rise.
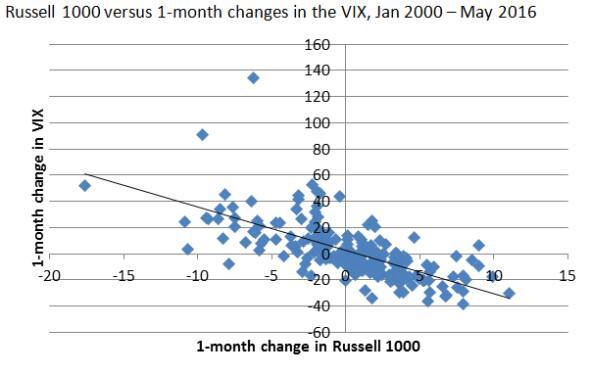
These characteristics create incentives for investment managers to hedge downside risk but also create opportunities in subsequent periods, in the wake of a so-called 'black swan' events, to position portfolios for enhanced returns.
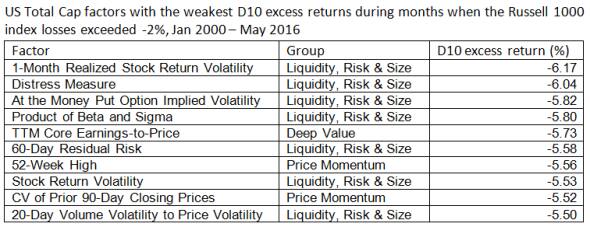
Analysing the lowest ranked 10% of names in the US Total Cap universe (covering 98% of cumulative market cap), the weakest factor returns during market declines (of more than 2%) over the past 16 years is led by the highest risk names captured by 1-Month Realised Stock Return Volatility factor which unperformed consistently across 43 of the 47 'events' during the sample period. As seen in the table above - liquidity and risk measures clearly dominate the poor performers identified during a market decline.
Looking towards fundamentals that outline more traditional 'stock picking' factors, shows that the worst ranked companies according to TTM Core Earnings-to-Price factor have suffered the brunt of market down turns. This implies that companies overvalued on earnings multiples are expected to decline the most on average.
Post black swan
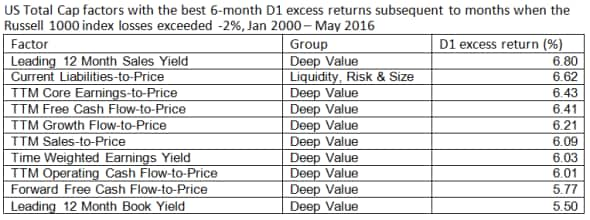
While successfully avoiding names expected to fall the most in a market moving event, positioning for subsequent recoveries is perhaps more pragmatic. Across the 47 episodes identified, the top factor returns in the subsequent six months have been evaluated across the top 10% of companies' ranks across the factor library.
Companies ranking highly according to Deep Value factors are the clear outperformers in subsequent bounces post market declines, with the top factor being Leading 12 Month Sales Yield.
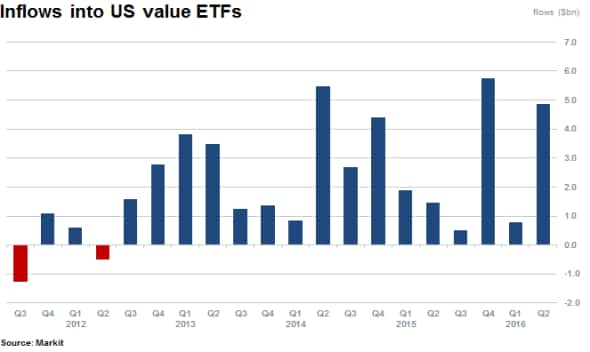
Perhaps pragmatic US investors, pre-empting a potential market moving event, might explain the $5.6bn of inflows into US value ETFs seen so far in 2016. The category has accumulated almost a net $43bn in the past five years with $106bn in current assets under management.
Relte Stephen Schutte | Analyst, Markit
Tel: +44 207 064 6447
relte.schutte@markit.com
S&P Global provides industry-leading data, software and technology platforms and managed services to tackle some of the most difficult challenges in financial markets. We help our customers better understand complicated markets, reduce risk, operate more efficiently and comply with financial regulation.
This article was published by S&P Global Market Intelligence and not by S&P Global Ratings, which is a separately managed division of S&P Global.
{"items" : [
{"name":"share","enabled":true,"desc":"<strong>Share</strong>","mobdesc":"Share","options":[ {"name":"facebook","url":"https://www.facebook.com/sharer.php?u=http%3a%2f%2fwww.spglobal.com%2fmarketintelligence%2fen%2fmi%2fresearch-analysis%2f22062016-equities-hedging-for-brexit-and-black-swans.html","enabled":true},{"name":"twitter","url":"https://twitter.com/intent/tweet?url=http%3a%2f%2fwww.spglobal.com%2fmarketintelligence%2fen%2fmi%2fresearch-analysis%2f22062016-equities-hedging-for-brexit-and-black-swans.html&text=Hedging+for+Brexit+and+%27black+swans%27","enabled":true},{"name":"linkedin","url":"https://www.linkedin.com/sharing/share-offsite/?url=http%3a%2f%2fwww.spglobal.com%2fmarketintelligence%2fen%2fmi%2fresearch-analysis%2f22062016-equities-hedging-for-brexit-and-black-swans.html","enabled":true},{"name":"email","url":"?subject=Hedging for Brexit and 'black swans'&body=http%3a%2f%2fwww.spglobal.com%2fmarketintelligence%2fen%2fmi%2fresearch-analysis%2f22062016-equities-hedging-for-brexit-and-black-swans.html","enabled":true},{"name":"whatsapp","url":"https://api.whatsapp.com/send?text=Hedging+for+Brexit+and+%27black+swans%27 http%3a%2f%2fwww.spglobal.com%2fmarketintelligence%2fen%2fmi%2fresearch-analysis%2f22062016-equities-hedging-for-brexit-and-black-swans.html","enabled":true}]}, {"name":"rtt","enabled":true,"mobdesc":"Top"}
]}


