Customer Logins
Obtain the data you need to make the most informed decisions by accessing our extensive portfolio of information, analytics, and expertise. Sign in to the product or service center of your choice.
Customer Logins
CREDIT COMMENTARY
May 19, 2015
Sharp selloff in long maturity US treasuries
An abrupt shift in 10 and 30 year US treasury yields has caused investors to sell long dated bonds at record pace.
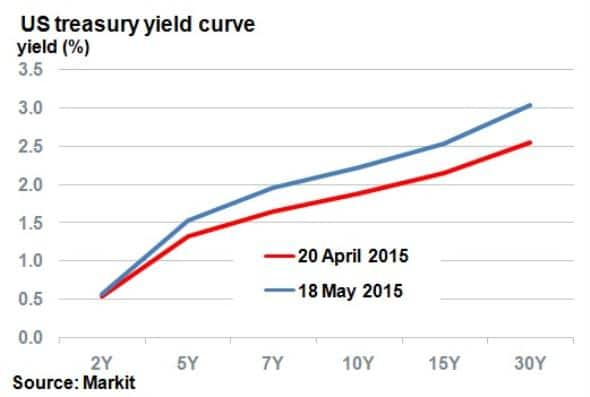
- Long end US treasuries have sold off 50bps over the past month but short end only 3bps
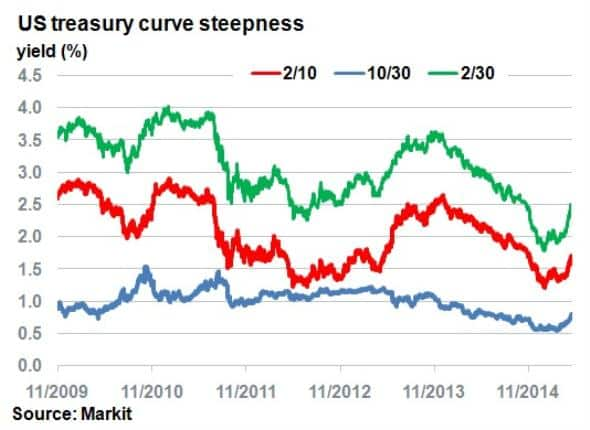
- Treasury curve steepness has returned to Dec 2014 level, previously seen in 2012
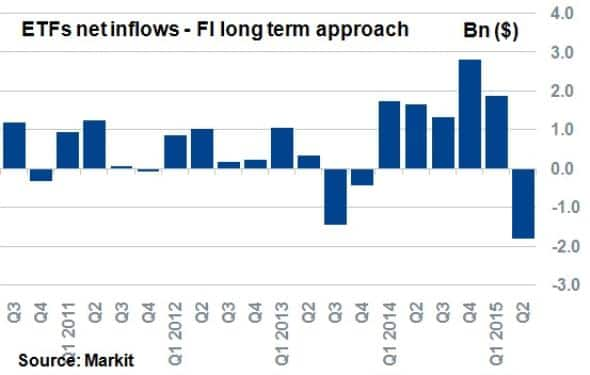
- This quarter has seen $1.8bn of outflows from ETFs with a long term FI approach
The past month has certainly caused turbulence in bond markets. Some sectors such as US high yield have held up and Asian corporates have actually outperformed, while sovereign and long duration bonds have sold off.

Over the last four weeks 10-yr US treasuries and 30-yr US treasuries have gained 32bps and 50bps respectively. A combination of a selloff in sovereign bonds in Europe causing a similar shift in treasuries, and increased inflation expectations due to rising oil prices have caused downward pressure on long term bond prices.
In contrast, the two year rate has gained a mere 3bps over the period as growth and short term fed funds rate expectations remained stationary, steepening the yield curve.

The shape of the yield curve, as determined by its steepness, is important because it is often an indicator of an economy going through expansion or recession.
From November 2013 till present, the difference between the 2-yr treasury rate and the 30-yr (2/30-yr), which determines the steepness of the US yield curve, has fallen from 3.5% to 2.5%. This figure reached a low of 2% before the recent sharp selloff in treasuries, which pushed it back up to 2.5%.
Markets react
The magnitude of the recent uptick in curve steepness has caught many market participants by surprise, especially since the last time such a move occurred was during times of unconventional monetary policy.
The last time the long end (10/30-yr) saw such steepening was in mid-2011, when the Fed concluded QE2 and investors fled the accommodative environment. On the shorter end, the 'taper tantrum' in 2013 caused the 2/10-yr yield difference to jump 100bps, but this recent spike has a long way to go to match that.
With the Fed looking to phase out zero interest rate policy later this year, all eyes will be on how the US yield curve will react to normalisation.

Fixed income ETF investors have been quick to react, with the last six weeks witnessing $2bn of outflows from US treasury long bond ETFs. This has far outstripped anything on record for ETFs with this investment approach; highlighting the extent to which investors were caught by the sharpness of the recent selloff. The only other quarter which saw an outflow greater than $1bn was in Q3 2013, when the 'taper tantrum' had a significant effect on treasury price volatility.
In contrast ETFs with a short term approach have continued to receive inflows, demonstrating the anti-clockwise shift in the yield curve.
Neil Mehta | Analyst, Fixed Income, Markit
Tel: +44 207 260 2298
Neil.Mehta@markit.com
S&P Global provides industry-leading data, software and technology platforms and managed services to tackle some of the most difficult challenges in financial markets. We help our customers better understand complicated markets, reduce risk, operate more efficiently and comply with financial regulation.
This article was published by S&P Global Market Intelligence and not by S&P Global Ratings, which is a separately managed division of S&P Global.
{"items" : [
{"name":"share","enabled":true,"desc":"<strong>Share</strong>","mobdesc":"Share","options":[ {"name":"facebook","url":"https://www.facebook.com/sharer.php?u=http%3a%2f%2fwww.spglobal.com%2fmarketintelligence%2fen%2fmi%2fresearch-analysis%2f19052015-credit-sharp-selloff-in-long-maturity-us-treasuries.html","enabled":true},{"name":"twitter","url":"https://twitter.com/intent/tweet?url=http%3a%2f%2fwww.spglobal.com%2fmarketintelligence%2fen%2fmi%2fresearch-analysis%2f19052015-credit-sharp-selloff-in-long-maturity-us-treasuries.html&text=Sharp+selloff+in+long+maturity+US+treasuries","enabled":true},{"name":"linkedin","url":"https://www.linkedin.com/sharing/share-offsite/?url=http%3a%2f%2fwww.spglobal.com%2fmarketintelligence%2fen%2fmi%2fresearch-analysis%2f19052015-credit-sharp-selloff-in-long-maturity-us-treasuries.html","enabled":true},{"name":"email","url":"?subject=Sharp selloff in long maturity US treasuries&body=http%3a%2f%2fwww.spglobal.com%2fmarketintelligence%2fen%2fmi%2fresearch-analysis%2f19052015-credit-sharp-selloff-in-long-maturity-us-treasuries.html","enabled":true},{"name":"whatsapp","url":"https://api.whatsapp.com/send?text=Sharp+selloff+in+long+maturity+US+treasuries http%3a%2f%2fwww.spglobal.com%2fmarketintelligence%2fen%2fmi%2fresearch-analysis%2f19052015-credit-sharp-selloff-in-long-maturity-us-treasuries.html","enabled":true}]}, {"name":"rtt","enabled":true,"mobdesc":"Top"}
]}


