Customer Logins
Obtain the data you need to make the most informed decisions by accessing our extensive portfolio of information, analytics, and expertise. Sign in to the product or service center of your choice.
Customer Logins
EQUITIES COMMENTARY
Dec 09, 2015
Key factors driving equities in 2015
Equities are set to post some of their most disappointing returns for several years, yet the disappointing headline number hides wide return differences both across sectors and single names; this report looks at the factors which had the best track record of uncovering return variations over 2015.
- Staying clear of falling knives key in US and Europe proved a winning strategy
- European investors were rewarded for targeting quality return on equity
- Risk factors in Apac successfully signal distressed names ahead of market sell off
The global market turbulence felt over the second half of the year saw markets give up much of the ground gained in the opening months. These relatively flat markets have been disappointing for passive investors yet the returns were not uniform across the board as evidenced by the strong returns delivered through several of the Research signals factors since the start of the year.
One trend that is evident at first glance is the fact that factor returns this year were much more pronounced on the lower ranked 10th decile rather than their peers on the opposite end of the scale. The key takeaway from this is that the current market favoured investors which avoided losers rather than the opposite end of the scale.
Factoring in US returns
Although the S&P500 looks set to finish where it started at the beginning of the year, it has been an eventful year in US and global equity markets. With large multinationals battling the strengthening dollar, a US recovery has been characterised by a narrow rally in the second half of the year, led by price momentum in key large cap names.

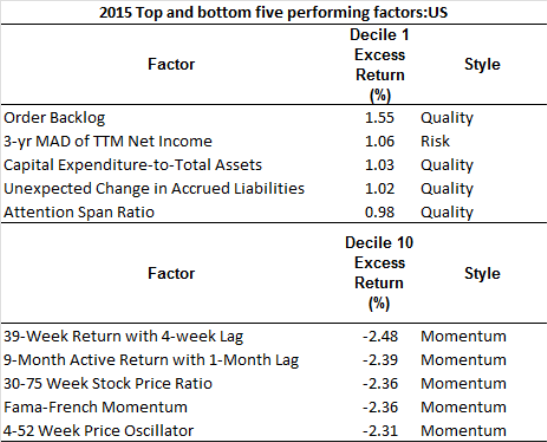
While price momentum based strategies have been profitable, investors have been duly rewarded for holding quality according to Research Signals top performing factors of the year. Almost two thirds of top performing equity factors in the US are quality styled factors with momentum and value factors making honourable mentions.
The best performing factor thus far in 2015 is Order Backlog with an average monthly return of 1.55%. The factor is a gauge of future expected sales scaled by firm assets. Average monthly returns have been roughly double that of the current S&P 500's total yearly return trajectory.
While stocks with the highest levels of price momentum have been rewarded in 2015investors have been strongly avoiding names with the worst ranked levels of price momentum. Momentum based factors across 10th decile names - (representing low momentum) crowd out the worst ten performers of 2015 with an average monthly underperformance of -2.48%. The worst performers have been stocks which ranked the lowest according to the factor; 39-Week Return with 4-week lag.
Europe
Despite losing some ground over the last week due to market disappointment of further ECB stimulus measures, European markets have performed relatively well year to date with the STOXX Europe 600 index up 7.6%.

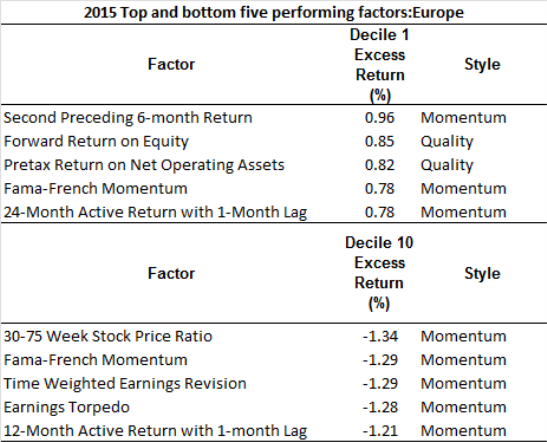
Echoing trends seen in the US, top quality and momentum names feature predominantly in the top performing stocks.
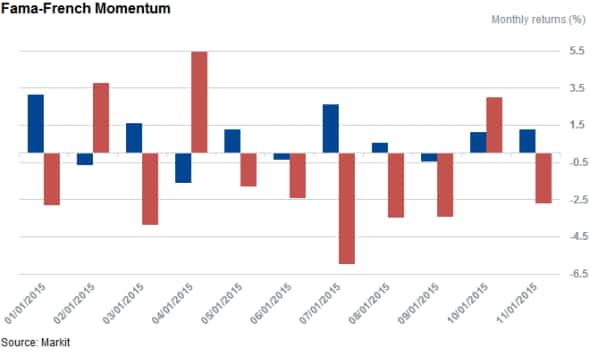
Measuring price performance over a 10-month period with a 2-month lag, the classic Fama-French Momentum factor delivered top ten performances across stocks with the most and least levels of momentum in Europe. This is indicative of the laggards continuing to underperform during the year.

Forward Return on Equity in Europe has also been an indicator that investors have been rewarded, suggesting that investors favoured firms with positive analyst sentiment. On the flipside, investors have punished firms with the weakest Time Weighted Earnings Revisions which ranks firms according to earnings downgrades.
Asia-Pacific
In Apac, momentum has also been a winning trend, however the lower ranked names have been the worst performers according to risk signals.

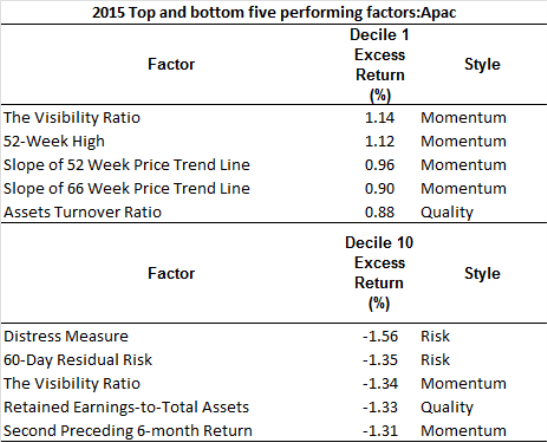
In Apac the top performing factor with a 1.14% average monthly return has been the Visibility Ratio which is equal to a stock's most recent daily trading volume divided by the average daily trading volume in previous 50 trading days.
Correlation between this factor and the second best performing factor, 52-Week High, increased during the start of the year suggesting that stocks trading near their highs increased in unusually high volumes. The selloff during the middle of the year in resource based emerging markets resulted in the above relationship mean reverting.
Stocks that mostly ranked poorly according to risk factors on average underperformed in Apac, indicating the effectiveness of these signals during a tumultuous year in Apac markets. The worst performing names ranked poorly according to Distress Measure and 60-Day Residual Risk. Names ranking in the 10th decile across the Distress Measure factor, delivered -1.56% average returns per month during 2015.
Relte Stephen Schutte | Analyst, Markit
Tel: +44 207 064 6447
relte.schutte@markit.com
S&P Global provides industry-leading data, software and technology platforms and managed services to tackle some of the most difficult challenges in financial markets. We help our customers better understand complicated markets, reduce risk, operate more efficiently and comply with financial regulation.
This article was published by S&P Global Market Intelligence and not by S&P Global Ratings, which is a separately managed division of S&P Global.
{"items" : [
{"name":"share","enabled":true,"desc":"<strong>Share</strong>","mobdesc":"Share","options":[ {"name":"facebook","url":"https://www.facebook.com/sharer.php?u=http%3a%2f%2fwww.spglobal.com%2fmarketintelligence%2fen%2fmi%2fresearch-analysis%2f09122015-Equities-Key-factors-driving-equities-in-2015.html","enabled":true},{"name":"twitter","url":"https://twitter.com/intent/tweet?url=http%3a%2f%2fwww.spglobal.com%2fmarketintelligence%2fen%2fmi%2fresearch-analysis%2f09122015-Equities-Key-factors-driving-equities-in-2015.html&text=Key+factors+driving+equities+in+2015","enabled":true},{"name":"linkedin","url":"https://www.linkedin.com/sharing/share-offsite/?url=http%3a%2f%2fwww.spglobal.com%2fmarketintelligence%2fen%2fmi%2fresearch-analysis%2f09122015-Equities-Key-factors-driving-equities-in-2015.html","enabled":true},{"name":"email","url":"?subject=Key factors driving equities in 2015&body=http%3a%2f%2fwww.spglobal.com%2fmarketintelligence%2fen%2fmi%2fresearch-analysis%2f09122015-Equities-Key-factors-driving-equities-in-2015.html","enabled":true},{"name":"whatsapp","url":"https://api.whatsapp.com/send?text=Key+factors+driving+equities+in+2015 http%3a%2f%2fwww.spglobal.com%2fmarketintelligence%2fen%2fmi%2fresearch-analysis%2f09122015-Equities-Key-factors-driving-equities-in-2015.html","enabled":true}]}, {"name":"rtt","enabled":true,"mobdesc":"Top"}
]}


