Customer Logins
Obtain the data you need to make the most informed decisions by accessing our extensive portfolio of information, analytics, and expertise. Sign in to the product or service center of your choice.
Customer Logins
EQUITIES COMMENTARY
Feb 09, 2015
Low beta bulls
Contrary to previous market bull runs, the recent market highs have been driven by historically safe names as low beta shares have largely outperformed their peers on the riskier end of the market.
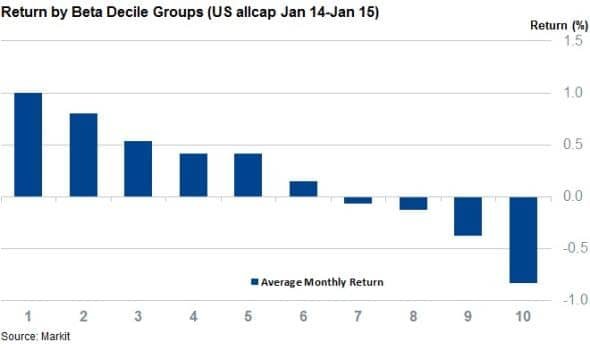
- Shares in the lowest beta group have outperformed their peers on the other side of the spectrum by 1.8% per month on average over the last 12 months
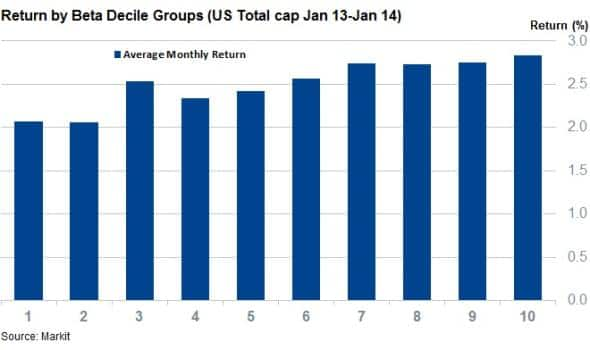
- This trend marks a reversal of 2013 when highly volatile shares drove market returns
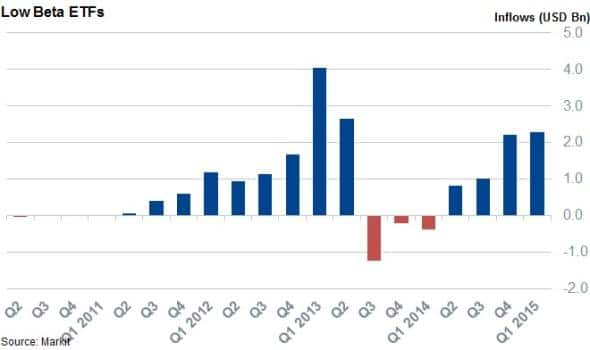
- ETF investors have greatly preferred low beta products in recent years
While the market is still hovering around the all-time highs seen in the closing days of last year, a review of the shares which have driven the recent market surge shows that the risk appetite seen during previous market swells is not evident in the current trading environment. Instead, historically low risk shares have been favoured by investors over the last 12 months.
A closer look at the 60 Month Beta factor in Markit's Research Signals shows that the shares at the low risk end of the spectrum have largely driven market returns over the last year in US shares. The factor regresses individual monthly stock returns with those of the broader market over the previous five years and assigns a low rank to shares whose market-adjusted price swings are low, while those on the other side of the risk spectrum score high. Grouping these shares by the ranks assigned by the factor sees that historically low risk names have driven the market over the last year.
Low beta names outperform
The average monthly return of the shares in the decile group with the lowest historical market adjusted volatility has outperformed the market by over 10.5% in the 12 months leading up to the start of February. This trend has shown no signs of slowing down, as January saw historically safe names outperformed by their widest margin of the last 13 months and marked the six month in a row when the lowest risk names outperformed the market.

On the other side of the volatility spectrum, the shares in the highest beta group have trailed the market in ten of the 13 months since January 2014. This consistent underperformance relative to the market has cumulated to over 12% against the overall Markit US Total Cap universe.
This phenomenon is not isolated to the extremes of the factor, as the average monthly returns across the beta decile groups have shown a strong relationship across the entire volatility spectrum.
This new trend marks a complete reversal to 2013's developments, where high beta names powered the market past its pre-crisis levels. That year saw the shares in the most volatile decile group lead the market to new highs as these shares outperformed the broader universe by over 4%.

Trend plays into ETF investors' hands
ETFs which track low volatility shares make up the great majority of beta products tracked by strategy ETFs, and the recent strong run among low volatility shares has seen investors add over $6bn of exposure in low beta funds since the second quarter of last year when the trend gathered pace in earnest.

hese inflows look to have paid off for investors, as the largest of these funds, the PowerShares S&P 500 Low Volatility Portfolio ETF, has outperformed the broader SPDR S&P 500 ETF by 7% since the start of 2014.
More practically, low beta's strong performance since the start of last year has played into the hands of large cap shares as the large cap blue chip S&P 500 index has largely outperformed the Russell 2000 index which is made up of smaller, more volatile performers. In a similar vein, the iShares Russell 2000 ETF's total return since last January has trailed that of the SPDR S&P 500 ETF by 9%.
Simon Colvin | Research Analyst, Markit
Tel: +44 207 264 7614
simon.colvin@markit.com
S&P Global provides industry-leading data, software and technology platforms and managed services to tackle some of the most difficult challenges in financial markets. We help our customers better understand complicated markets, reduce risk, operate more efficiently and comply with financial regulation.
This article was published by S&P Global Market Intelligence and not by S&P Global Ratings, which is a separately managed division of S&P Global.
{"items" : [
{"name":"share","enabled":true,"desc":"<strong>Share</strong>","mobdesc":"Share","options":[ {"name":"facebook","url":"https://www.facebook.com/sharer.php?u=http%3a%2f%2fwww.spglobal.com%2fmarketintelligence%2fen%2fmi%2fresearch-analysis%2f09022015-Equities-Low-beta-bulls.html","enabled":true},{"name":"twitter","url":"https://twitter.com/intent/tweet?url=http%3a%2f%2fwww.spglobal.com%2fmarketintelligence%2fen%2fmi%2fresearch-analysis%2f09022015-Equities-Low-beta-bulls.html&text=Low+beta+bulls","enabled":true},{"name":"linkedin","url":"https://www.linkedin.com/sharing/share-offsite/?url=http%3a%2f%2fwww.spglobal.com%2fmarketintelligence%2fen%2fmi%2fresearch-analysis%2f09022015-Equities-Low-beta-bulls.html","enabled":true},{"name":"email","url":"?subject=Low beta bulls&body=http%3a%2f%2fwww.spglobal.com%2fmarketintelligence%2fen%2fmi%2fresearch-analysis%2f09022015-Equities-Low-beta-bulls.html","enabled":true},{"name":"whatsapp","url":"https://api.whatsapp.com/send?text=Low+beta+bulls http%3a%2f%2fwww.spglobal.com%2fmarketintelligence%2fen%2fmi%2fresearch-analysis%2f09022015-Equities-Low-beta-bulls.html","enabled":true}]}, {"name":"rtt","enabled":true,"mobdesc":"Top"}
]}


