S&P Global Offerings
Featured Topics
Featured Products
Events
S&P Global Offerings
Featured Topics
Featured Products
Events
S&P Global Offerings
Featured Topics
Featured Products
Events
Banking & Capital Markets
Economy & Finance
Energy Transition & Sustainability
Technology & Innovation
Podcasts & Newsletters
Banking & Capital Markets
Economy & Finance
Energy Transition & Sustainability
Technology & Innovation
Podcasts & Newsletters
S&P Global Offerings
Featured Topics
Featured Products
Events
Research — 13 Dec, 2022

By Tony Lenoir
The weighted average U.S. solar capacity factor stayed flat year over year in 2021. This possibly reflected greater operational efficiency, as more than 58% of the states individually operating in excess of 100 MW of utility-scale photovoltaic capacity experienced solar radiation below the norm. Negative climatology deviations ranged from -0.1% in Nevada to -4.6% in Mississippi.

* The average capacity factor of U.S. solar projects operating all 12 months in 2021 was 24.4% nationally, in line with 2020 levels. Regionally, the metric receded in large swaths of the country, notably in the area served by Electric Reliability Council of Texas Inc., or ERCOT, which currently has the largest utility-scale solar pipeline.
* The Desert Southwest continues to dominate top-ranked states by solar capacity factor, and as well as its solar-energy-friendly climate, now offers the added benefit of many areas qualifying as energy communities under the Inflation Reduction Act of 2022.
* Independent System Operators, or ISOs, in the eastern half of the U.S. logged solar capacity gains from 2020 to 2021 — an encouraging development, given the size of the solar pipeline in states such as Ohio, New York, Illinois and Indiana.


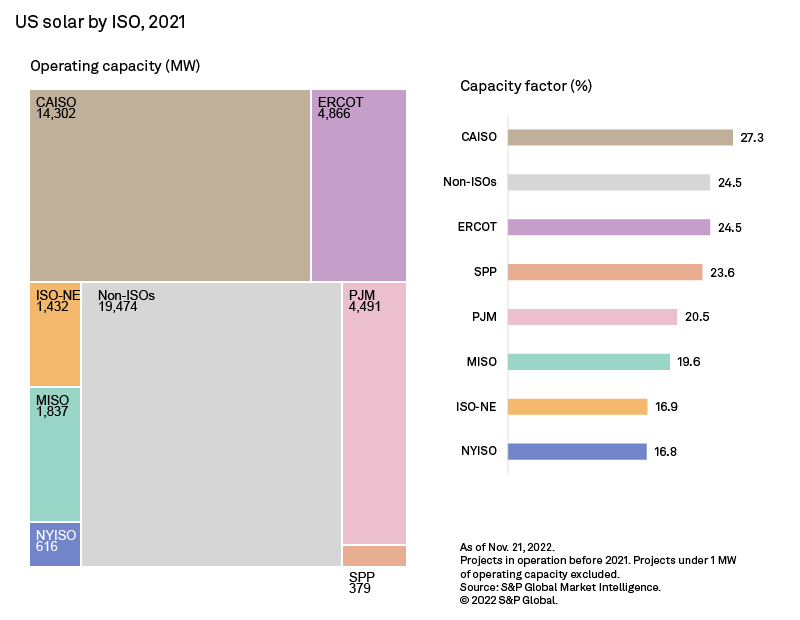
Nationally, the U.S. solar projects that operated all 12 months in 2021 achieved a 24.4% weighted average solar capacity factor, but three ISOs logged solar capacity factor declines. These included ERCOT, which has the largest solar pipeline of all the ISOs; at 72GW, it is more than double that of second-placed PJM Interconnection LLC. Solar capacity leader California ISO extended its lead, up 50 basis points year over year, averaging a factor of 27.3%.
Midcontinent ISO, New York ISO and PJM also ended in positive territory, although the three eastern U.S. ISOs continue to have solar capacity factors below the national average. But that is not lowering solar ambitions across these territories. Ohio, New York, Illinois and Indiana are all in the top 10 states by planned utility-scale solar projects, with a combined solar pipeline of more than 36 GW. Solar capacity factors for projects operating in these states in 2021 ranged between roughly 17% and 19%.
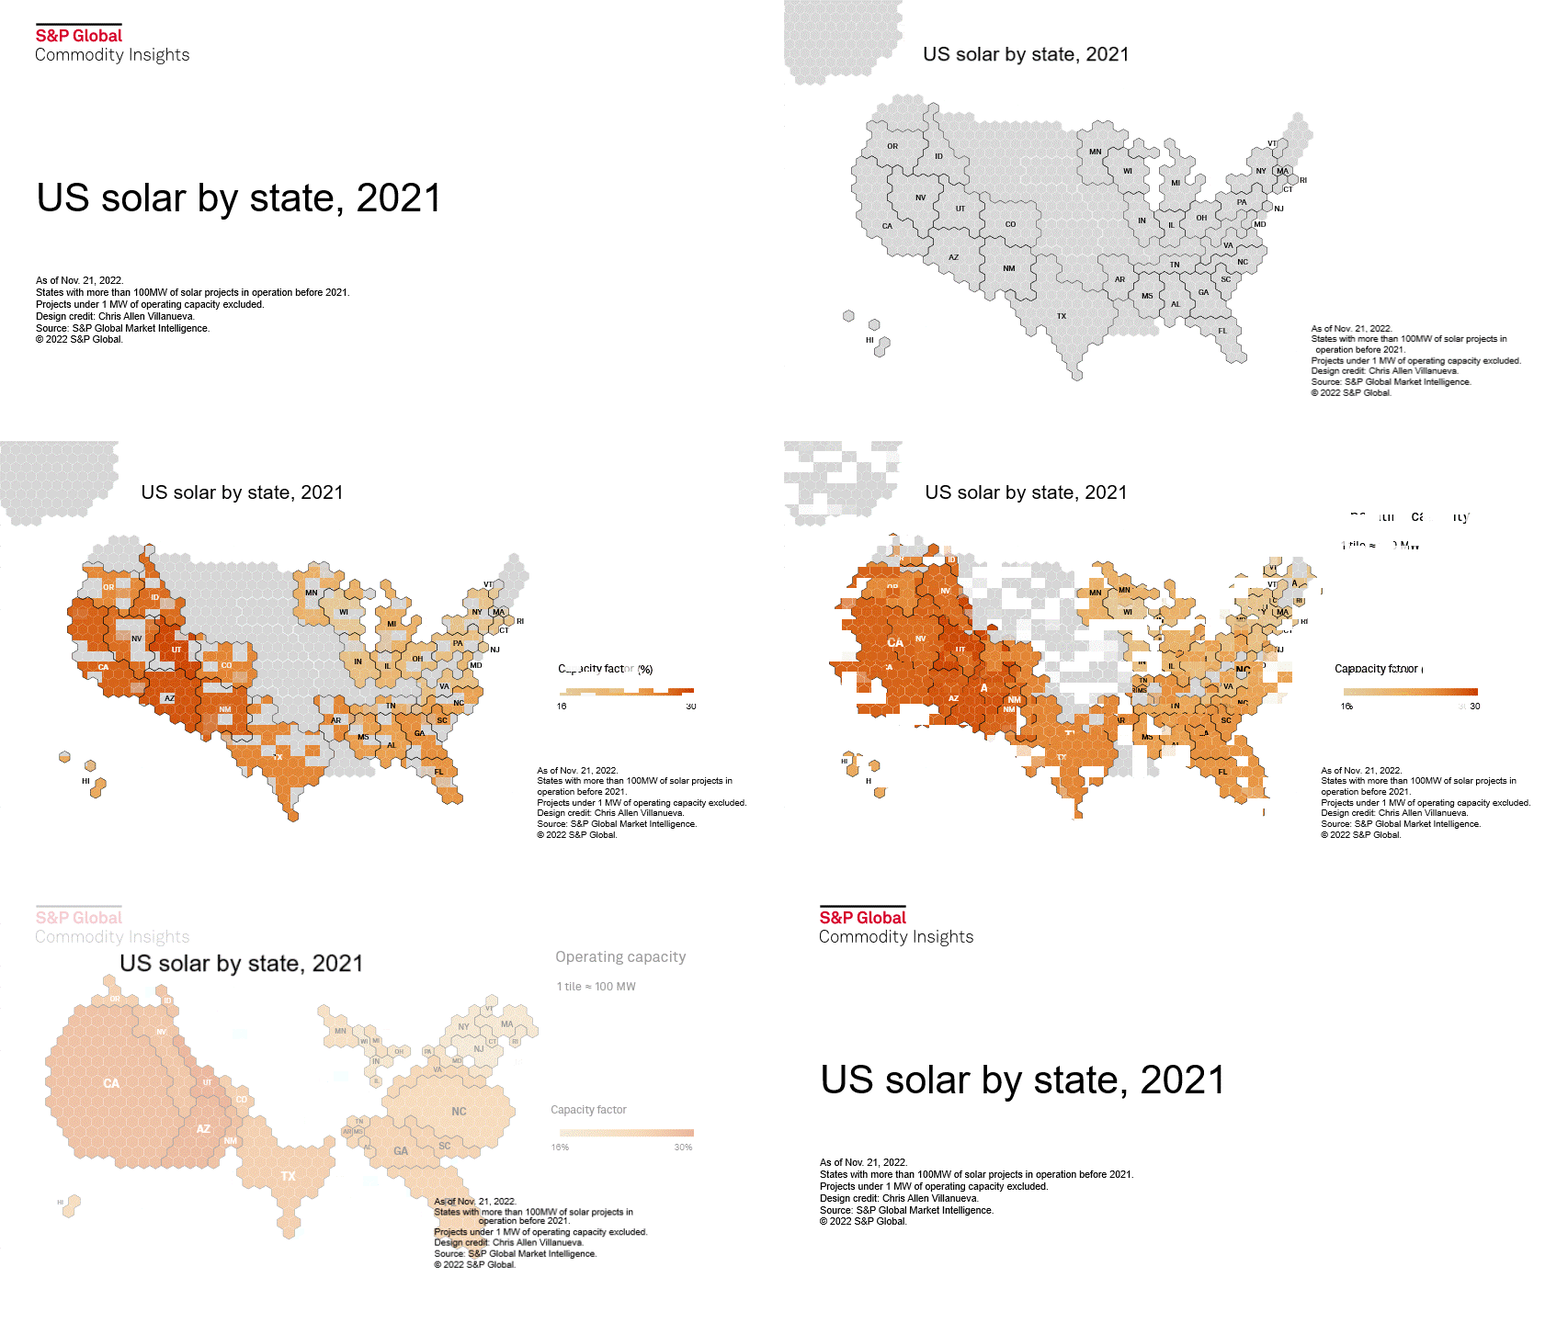
In 2021, the solar capacity factors of more than a third of the states operating in excess of 100 MW of solar capacity — including U.S. Desert Southwest states Arizona, New Mexico, Nevada and Utah — fell year over year. Wisconsin logged the largest drop, down 3.7%.
For the U.S. Southwest, however, the slide was minimal, and the region continues to dominate the U.S. solar capacity leaderboard, with Utah and Arizona — at 29.3% and 28.4%, respectively — at the very top. New Mexico-based utility-scale solar projects, which operated over 720 MW of capacity in 2021, averaged a 27.3% solar capacity factor. Utility-scale solar projects in Nevada, the lowest-placed state in the region, logged a 1.8-percentage-point drop year over year, but still achieved a 26.5% average – the sixth highest in the country.

For all their abundant solar resources, the listed Desert Southwest states combined had less than 7 GW of utility-scale solar capacity in 2021, based on projects online as of Dec. 31, 2020. California alone had twice as much. That said, Arizona, New Mexico, Nevada and Utah have a combined 27 GW in the pipeline, with Nevada accounting for roughly half. The Inflation Reduction Act's energy community special rule could contribute to sending these figures much higher.
S&P Global Commodity Insights has identified 91 unique census tracts across Arizona, New Mexico, Nevada and Utah potentially qualifying for the eligible 10% increase to the act's baseline production and investment tax credits based on the law's "energy community" criteria of closed mines and retired coal-fired power plants. Across the region, an additional 23 census tracts may also become eligible, due to local coal power plants having announced plans to retire.
Twenty-six of the 114 census tracts identified based on the criteria above are in Nevada, which consistently features among the top states by average solar capacity factor. At the state level, Nevada experienced the third-largest average solar radiation from 2000 through 2019, according to an analysis of European Centre for Medium-Range Weather Forecasts climatology data. Combined, Nevada's solar resources, state renewable energy mandates, open land and potential energy community eligibilities arguably make the state a top destination for solar developers.


The S&P Global Market Intelligence Power Forecast paints a relatively healthy economic picture for new solar projects in Nevada. Projected net energy revenues, oscillating between $23.08/MWh and $30.00/MWh, easily surpass minimum debt servicing throughout the 10-year forecast interval. New solar is relatively inexpensive in Nevada, with the debt requirement ranging from $15.50/MWh through $20.33/MWh. That said, a full equity return is far out of reach from 2025 through 2033 and is met only once, in 2024, with the help of renewable energy credit revenue.
A couple of parameters drive the capacity factor of solar projects. Climatology is key, with highly insolated areas generally achieving higher capacity factors. Technology also plays a role, however. Traditional solar projects — made up of static, unifacial photovoltaic panels — underperform systems relying on bifacials and/or solar trackers, which allow solar panels to better follow the course of the sun throughout the day. But tracking solar panels are more expensive to construct and maintain, forcing developers to determine if the associated generation boost outweighs the higher cost.
For wholesale prices and supply and demand projections, see the S&P Global Market Intelligence Power Forecast.
Regulatory Research Associates is a group within S&P Global Commodity Insights.
S&P Global Commodity Insights produces content for distribution on S&P Capital IQ Pro.
Monesa Carpon and Kristin Larson contributed to this article.
This article was published by S&P Global Market Intelligence and not by S&P Global Ratings, which is a separately managed division of S&P Global.
