S&P Global Offerings
Featured Topics
Featured Products
Events
S&P Global Offerings
Featured Topics
Featured Products
Events
S&P Global Offerings
Featured Topics
Featured Products
Events
Banking & Capital Markets
Economy & Finance
Energy Transition & Sustainability
Technology & Innovation
Podcasts & Newsletters
Banking & Capital Markets
Economy & Finance
Energy Transition & Sustainability
Technology & Innovation
Podcasts & Newsletters
S&P Global Offerings
Featured Topics
Featured Products
Events
Research — 8 Jun, 2022

By Keith Nissen
Introduction
Approximately three-quarters of U.S. internet households own at least one smart TV, according to the Kagan first-quarter 2022 U.S. Consumer Insights survey. However, the ability to access online digital entertainment directly from a smart TV has had virtually no effect on consumer TV viewing behavior, according to the survey data.

* Survey data shows that smart TV owners watch slightly more online video, but otherwise their TV viewing behavior is nearly identical to that of non-smart TV households.
* The average U.S. internet household owns and operates 2.5 TVs. Average smart TV ownership is 1.2 devices per household.
* Samsung Electronics Co. Ltd. is by far the most popular brand of smart TV in the U.S. among surveyed internet adults.
* Among households owning only smart TVs, 67% own one or more streaming media devices, and households typically own different brands of smart TV.

Smart TVs are defined as televisions with an integrated TV application platform that permits access to online digital entertainment and related content directly from the device. Smart TVs encompass both high-definition, or HDTVs, as well as 4K TVs and 8K TVs. Nearly all TVs currently sold in the U.S. are smart TVs.
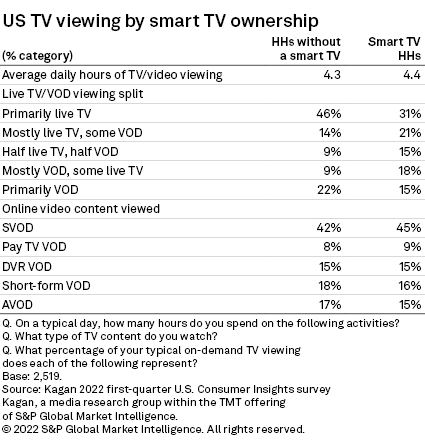
A comparison between smart TV and non-smart TV households reveals that both groups watch an average of over four hours of TV programming per day. Among households without a smart TV, 60% reported watching primarily or mostly live, linear TV compared to 52% for adults owning a smart TV. But owning a smart TV does not appear to promote substantially more online video viewing. One-third of adults who own a smart TV (33%) and those that do not (31%) cite watching mostly or primarily VOD content. The survey data also shows that subscription video on demand represents 45% of daily video viewing among smart TV owners; essentially the same as those without a smart TV (42%).

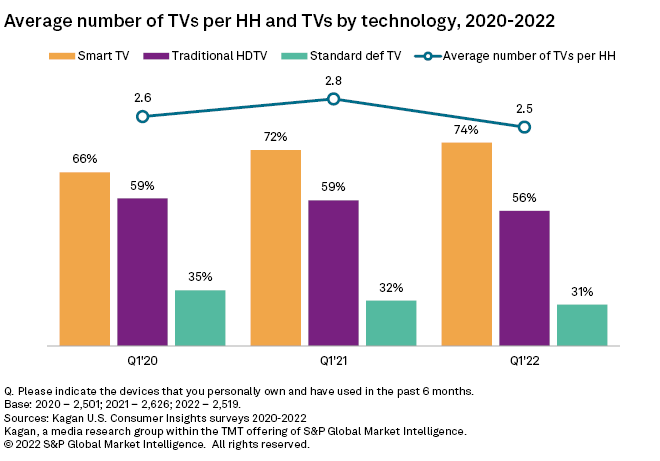
Historical survey data illustrates the rise in smart TV ownership in the U.S., expanding 8 percentage points over the past two years to 74%. Approximately nine out of 10 (88%) of those owning a smart TV reported accessing online digital entertainment from the device over the past month. The survey data also shows that the average number of TVs per internet household in the U.S. dipped slightly from 2.8 TVs per household in 2021 to 2.5 TVs in 2022, a result of declining ownership of traditional HDTVs, or non-smart TVs, and older standard-definition TVs.

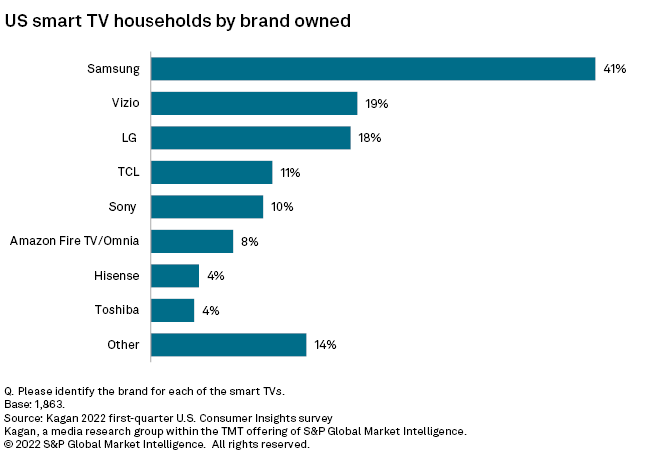
As of early 2022, U.S. internet households own an average of 1.2 smart TVs, according to the survey data. Nearly half (45%) of internet households own one smart TV, and another 29% own multiple smart TVs. Among surveyed internet adults owning a smart TV, 41% reported owning at least one Samsung Electronics Co. Ltd. smart TV. Vizio and LG Electronics Inc. were distant competitors, with 19% and 18% of U.S. smart TV households owning these brands, respectively. TCL Technology Group Corp. and Sony Group Corp. top the long tail of smart TV competitors with ownership shares of 11% or less.

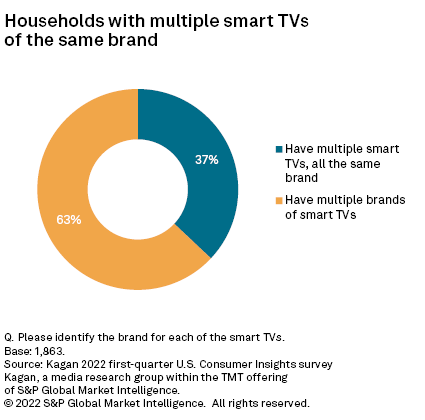
The use of streaming media devices, such as Roku Inc. 's Roku and Amazon.com Inc. 's Amazon Fire, in association with smart TVs appears to be extensive. Two-thirds (67%) of U.S. households that only own smart TVs report using streaming media players, as well. One possible explanation is that the majority (63%) of households operating multiple smart TVs own smart TVs of different brands. Streaming media devices offer an inexpensive means of providing a standardized user interface for accessing online content across any brand of smart TV.

Data presented in this article was collected from Kagan's Q1'22 U.S. Consumer Insights survey conducted in March 2022. The survey totaled 2,519 internet adults with a margin of error of +/- 1.9 percentage points at the 95% confidence level. Percentages are rounded to the nearest whole number.
Consumer Insights is a regular feature from Kagan, a media research group within S&P Global Market Intelligence's TMT offering, providing exclusive research and commentary.
This article was published by S&P Global Market Intelligence and not by S&P Global Ratings, which is a separately managed division of S&P Global.
