Featured Topics
Featured Products
Events
S&P Global Offerings
Featured Topics
Featured Products
Events
S&P Global Offerings
Featured Topics
Featured Products
Events
S&P Global Offerings
Featured Topics
Featured Products
Events
Financial and Market intelligence
Fundamental & Alternative Datasets
Government & Defense
Banking & Capital Markets
Economy & Finance
Energy Transition & Sustainability
Technology & Innovation
Podcasts & Newsletters
Financial and Market intelligence
Fundamental & Alternative Datasets
Government & Defense
Banking & Capital Markets
Economy & Finance
Energy Transition & Sustainability
Technology & Innovation
Podcasts & Newsletters
BLOG — Feb 17, 2022
Global supply chains made headlines throughout 2021, with delays and inflated freight rate under the spotlight, impacting many sectors. The perishable goods segment is likely to have an immediate impact with delays forecast to continue and "rise further in 2022" following an already sharp increase trajectory in 2021 as reported by recent industry research (https://www.hellenicshippingnews.com/reefer-container-freight-rates-to-outgun-dry-cargo-rates-in-2022). In the near-term, disruption looks likely to remain a topical issue, yet the perishable goods supply chain is an area with great potential in terms of international trade.
In this article, we focused on one typical perishable goods category - fruit - to illustrate how transactional and statistical data are often used together by sophisticated industry analysts to find market potential in this regard. Additionally, we'll examine how maritime port performance data may help identify logistics chokepoints and support operation optimization.
Data intelligence provided by IHS Markit Global Trade Analytics Suite (GTAS) and Container Port Performance provide excellent resources for industry players and investors looking for opportunities to find where the potential is and supporting the implementation of trade facilitation measures practically and effectively.
Refrigerated container or "Reefer" ships differ from conventional container ships in their size, design, power generation and electrical distribution equipment, thus any such trade is likely to need quality logistics services, equipment and technology and efficient operations.
GTAS U.S. Bill of Lading data confirms that fruit accounts for a large share of reefer container shipments. On the world scale, GTAS statistical data shows that trade in fruits is diverse and evolving both in terms of type and market. But a foundation for this is the advanced logistics capability to ensure the end market availability of fruits within a short time period in fresh condition. Due to the seasonality and geographical nature, the trade flow and logistics demand exhibits typical peak and valley periods. Last but not least, time is a critical element for perishable supply chains, contrary to other industry segments like consumer durables. As such, following ship movements and monitoring Container Port Performance and benchmarking port gateway performance can assure stakeholders in tracking cargo, assessing logistics quality generating intelligence to better estimate quality conditions at the end market.
It is commonly known that fruit is one of the major commodity types that transported with reefer equipment. Yet exactly how dependent is the reefer market to the fruit trade?
PIERS Bill of Lading Data within GTAS supports this practice of identifying the commodities that require such quality logistics by harnessing the reefer container flag.
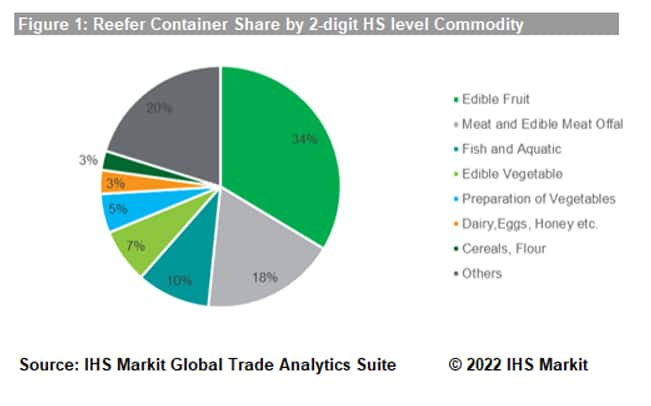
By examining a set of example U.S. transactional trade data from GTAS, in the period Nov - Dec 2021, major commodities that are transported using reefer containers are featured by fruits, meat, fish and aquatic and vegetable products. Edible fruits account for a full 34% or a third of the reefer container trade volume for the sample data queried, which is unsurprising owing to the perishable nature and temperature sensitivity requirements of this segment.
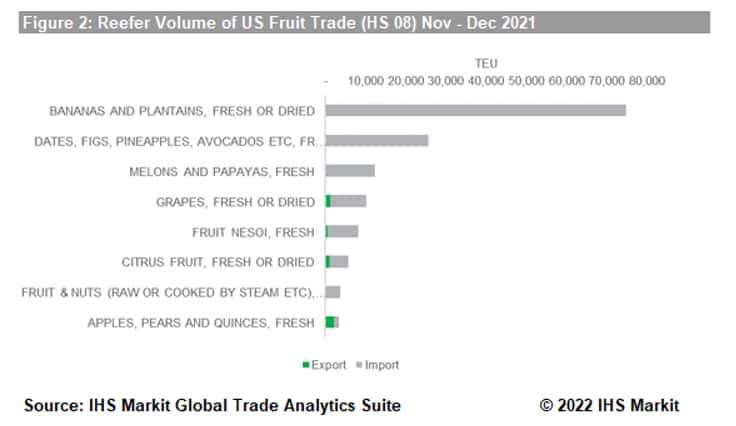
In the two months of Nov to Dec 2021, U.S. reefer fruit imports amounted to 144,886 TEU, of which bananas and plantains (74,679 TEU); dates, figs and pineapples (25,462 TEU); and melons and papayas (12,283 TEU) top the list. On the fruit export side, reefer equipment use is also significant in certain subcategories, with bananas, dates and melons at highest rate. This mean that the total trade of these goods are directly indicative of reefer container shipping need.
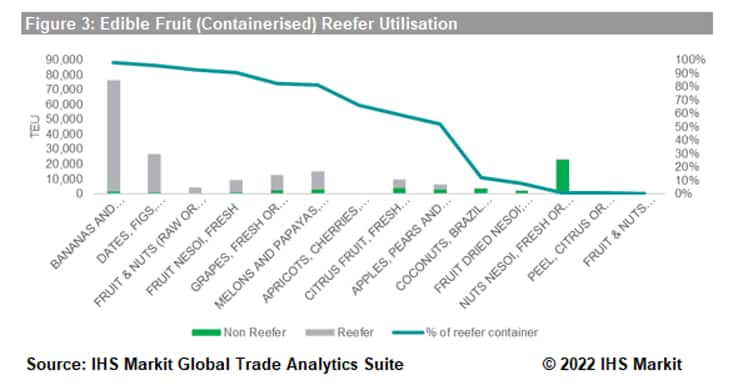
However, fruits are agriculture outputs that almost every country produces and exports in various volumes. What is the nature of this international trade flow and could it be sustained over time? Where is exactly the demand coming from?
Statistical trade data available within GTAS helps to answer such questions analysed by stakeholders when considering entering the reefer trade and transport market.
In addition to the U.S. sample analysis, we may extend and view the perishable market globally. Still focusing on the fruit (HS 08) trade, we may further narrow down the most addressable market of perishable fruit (i.e. those requiring refrigerated logistics and reefer equipment).
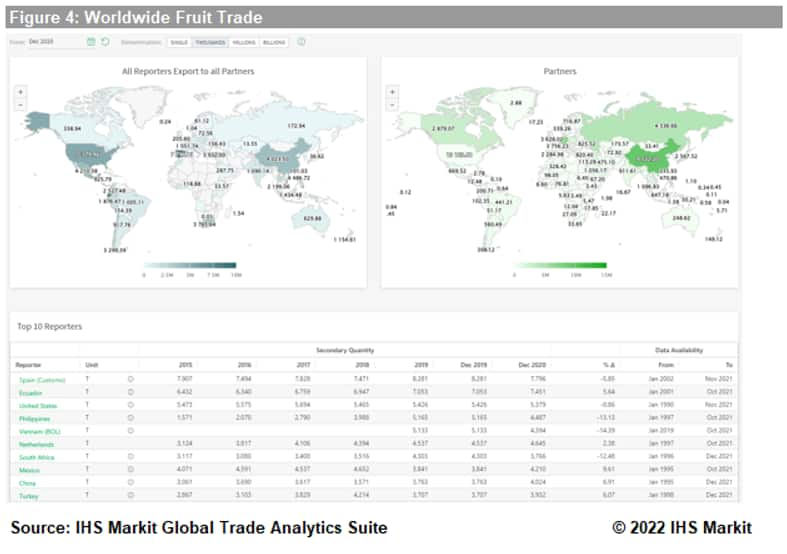
The atlas represents an international and dispersed network of cross-continental trade as seasons change. Fruit export markets are spread worldwide, with Spain (7.79 million MT) as the top exporter in 2020, followed by Ecuador (7.45 million MT) and United States (5.38 million MT); mainland China topped the importer market with 9.52 million MT in 2020.
Contributing to these volumes and seasonality could be the different geographical and climate features, catering to the diverse preferences of consumer tastes. Unlike other Agri products which might be more homogeneous and less sensitive to regional taste differences, global trade of fruits is thus boosted as end consumer preferences change, economic middle class expansions improve access to more global consumers, as well as advanced logistics and technology enabling physical access where demand is growing.
GTAS data also provides in depth insight into the supply and demand market size and products on individual trade lanes and flows.
Taking mainland China as a major market for example, import trade partners are keep evolving, with a varied product portfolio.
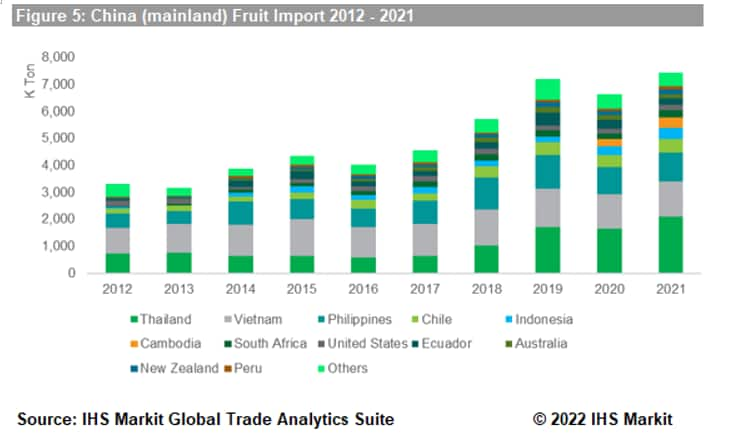
In the last decade, the regional trade partners to mainland China remain as top import origins. In 2021, China imported 2.09 million MT of fruit from Thailand as well as 1.30 million MT from Vietnam and Philippines ranking 2nd and 3rd. We also see distant trade partners, predominantly 0.51 million MT from Chile, and 0.26 million MT from South Africa. The diverse import origins imply the need for both long- and short- distance shipping needs for refrigerated services.
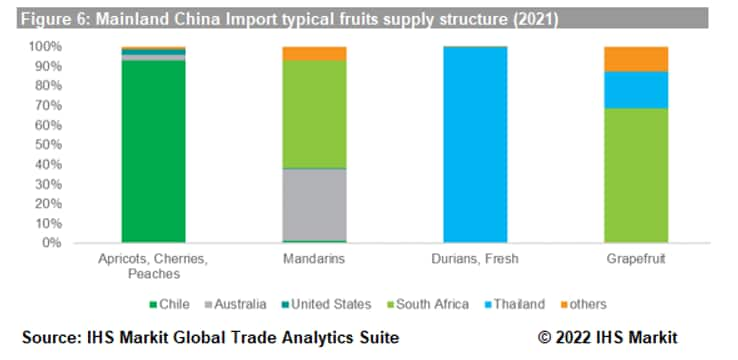
Focusing on a few of these import originations, allows analysts insight into the structure of imported fruit products featuring each country / region's specialties. Durians are imported wholly (100%) from Thailand; apricots, cherries and peaches are predominantly from Chile (93%); South Africa (55%) and Australia (37%) contribute over 90% of mandarins, while nearly 68% of grapefruit imports are from South Africa.
Extra Data Fields (EDFs) captured in GTAS may further enable understanding of underlying trade intelligence and generate deeper insight.
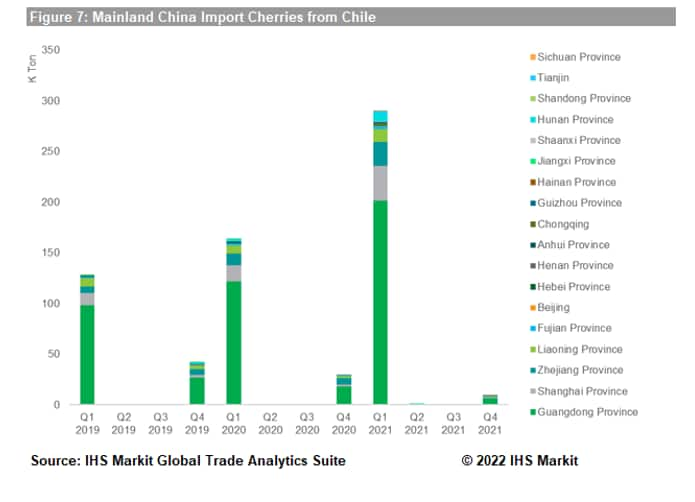
Mainland China, for example, provides EDF data covering trade by province. The provincial data may reflect several trade details not visible at the top-line country level. Taking cherry imports in the past three years for example, Guangdong and Shanghai are the key entry points in mainland China, which is not surprising as these are two prominent ports in the cold supply chain, featuring highly efficient ports and large annual port turnover. Thus, trade volume development and the import geographics are shaped by several factors such as local consumption, regional logistics readiness, port operation and border clearance facilitation measures.
GTASstatistical trade data provides over 200 countries / territories official trade data in one-stop-shop coverage. Global reporters' data with extra fields provide opportunities for reverse validation and deeper analysis.
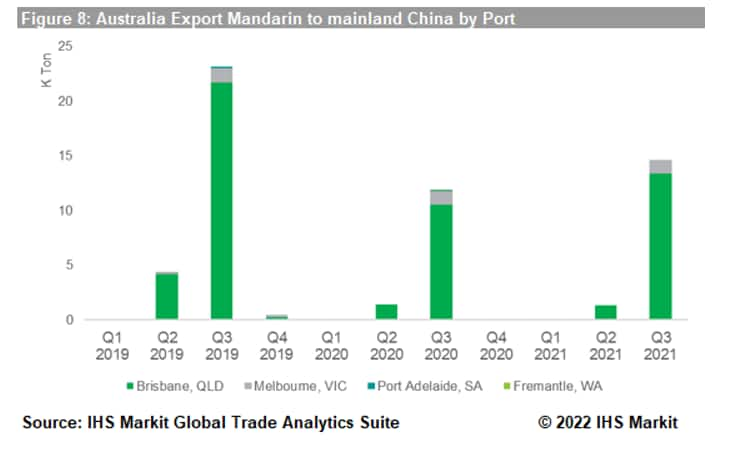
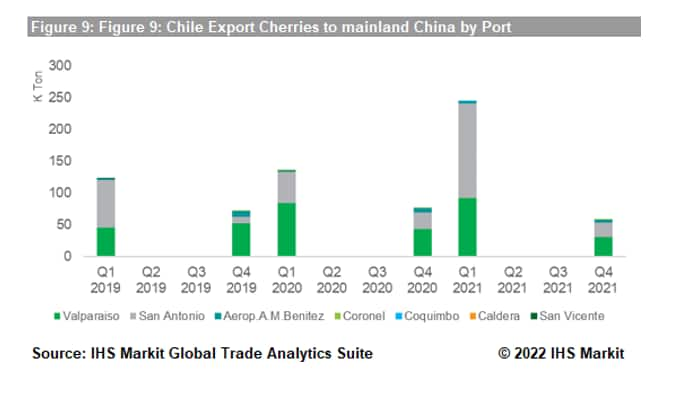
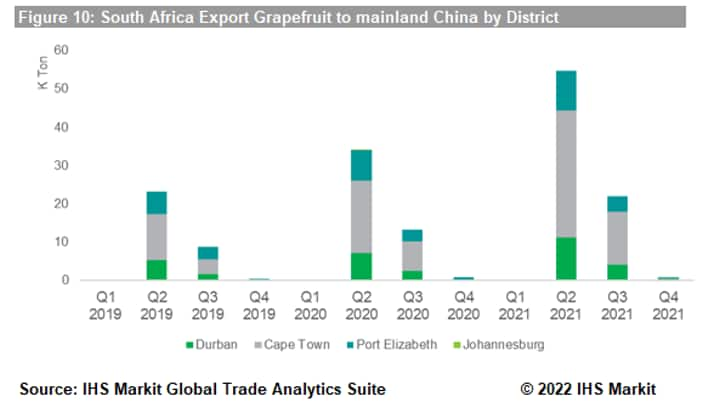
Supported by this, we may the reverse trade flows of mainland China's imported fruits: for example, South African grapfruit, Chilean cherries and Australian mandarins are reported by these originating countries. South Africa's grapefruit is exported in Q2 and Q3 each year, with Cape Town as the largest port of export. Mandarin from Australia are intensely exported in Q3, while cherries from Chile have their peak season in Q4 and Q1. These would mean in these months, reefer logistics / refrigerated equipment see a sharper demand.
Again, port-level details supplied by the available Extra Data Fields help unveil the shipping volume from more operational level. For Australia, Brisbane exports the majority of mandarins, Chilean cherries are departing from Valparaiso and San Antonio and three ports (Durban, Cape Town and Port Elizabeth) in South Africa are the departing points of grapefruits for China.
Port operations and border processes are critical elements for timely delivery of produce in good quality and this is particularly important for trade in fresh fruits. With Container Port Performance, we can examine and benchmark the respective performance for loading and discharge locations.
Facility operators and cargo owners employ IHS Markit Container Port Performance datasets to understand seasonal peaks, estimate lead time benchmarking efficiencies and identify any logistics chokepoints at specific ports.
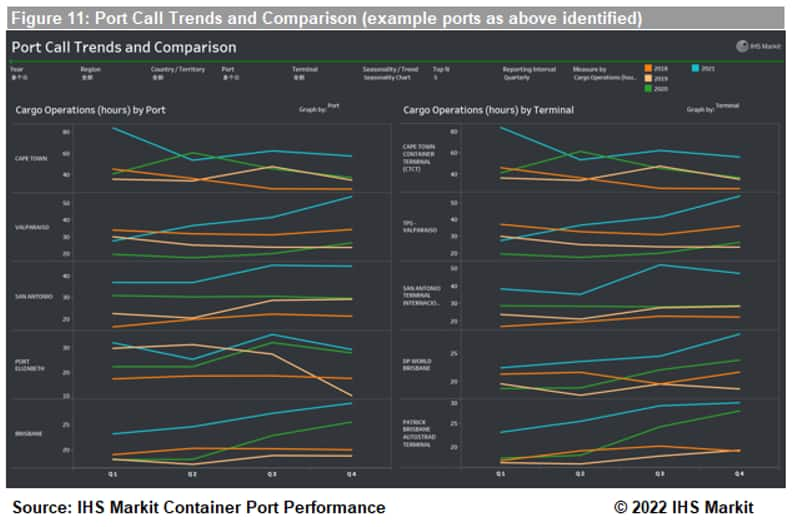
To illustrate this, we can continue with the fruit example above, including Brisbane (Australia), Cape Town and Johannesburg (South Africa), and Valparaiso and San Antonio (Chile).
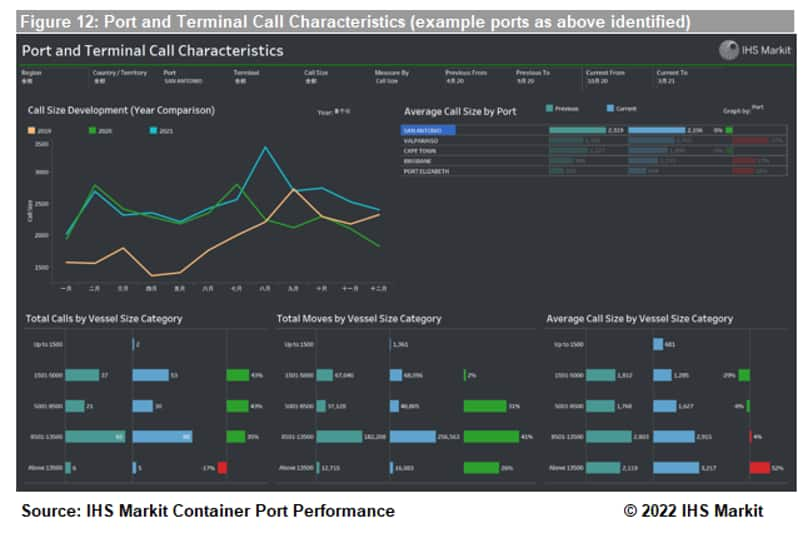
From a year-on-year perspective, all ports in the study saw extended cargo processing times in 2021 compared with previous years. This is not surprising given the rise in port delays worldwide over the past years, as well as industry trends such as bigger ships that require port operators to spend more time unloading for each call. In addition, from a seasonal perspective, as it relates to trade in fruits, we see clear increases in port call sizes and average quantity of moves. For example, Brisbane port cargo operation time averaged at 27.2 hours in Q3 2021, much higher than the 18.9 hours observed in Q3 2019. Similarly, San Antonio, Chile, measured 44.3 hours in Q4 2021 for cargo operations, compared with 29.1 hours in Q4 2019. For perishable and temperature sensitive goods, delays of even just a few hours means more reefer/refrigerated charging requirements.
These are just a few examples of the total data points captured by Container Port Performance datasets. More detailed benchmarking supports comparison between terminals, and assessment of other metrics for different target geographies and commodities.
The volatile and dynamic supply chain environment demands more transparency than ever before to continue to achieve sustainable outcomes. IHS Markit Maritime & Trade offers end-to-end coverage of the intelligence used by the world's leading organizations to effectively understand and respond to the threats and opportunities that continue to impact all organizations. Contact us today for a personalized introduction to a more informed, agile supply chain strategy.
Join us February 27-March 2 for the return to an in-person TPM 2022 in Long Beach, California, USA, the premier conference for the trans-Pacific and global container shipping and logistics community. This year's theme is Relationships Matter, hosted by Journal of Commerce (JOC) of IHS Markit. View the agenda, speakers and venue at events.joc.com/tpm and register today. We look forward to seeing you there!
For more details about Global Trade Analytics Suite (GTAS), please visit the product page: https://ihsmarkit.com/products/maritime-global-trade-analytics-suite.html and subscribe to our monthly newsletter and stay up-to-date with our latest analytics.
Posted 17 February 2022 by Yingzhi Zhang, Subject Matter Expert, Maritime,Trade & Supply Chain, S&P Global Market Intelligence
How can our products help you?
