S&P Global Offerings
Featured Topics
Featured Products
Events
S&P Global Offerings
Featured Topics
Featured Products
Events
S&P Global Offerings
Featured Topics
Featured Products
Events
Banking & Capital Markets
Economy & Finance
Energy Transition & Sustainability
Technology & Innovation
Podcasts & Newsletters
Banking & Capital Markets
Economy & Finance
Energy Transition & Sustainability
Technology & Innovation
Podcasts & Newsletters
S&P Global Offerings
Featured Topics
Featured Products
Events
Research — 11 May, 2023
In 1998 just 0.6% (608K) of US homes had broadband. But since the dot com bust early this century, high speed internet has gone from novelty to necessity with 2022 penetration including cable, telco, satellite or fixed wireless topping 87.4% (126.1 million). In 2022 the US broadband space generated $111.73 billion in total revenue, more than double its $51.09 billion 2012 top line.
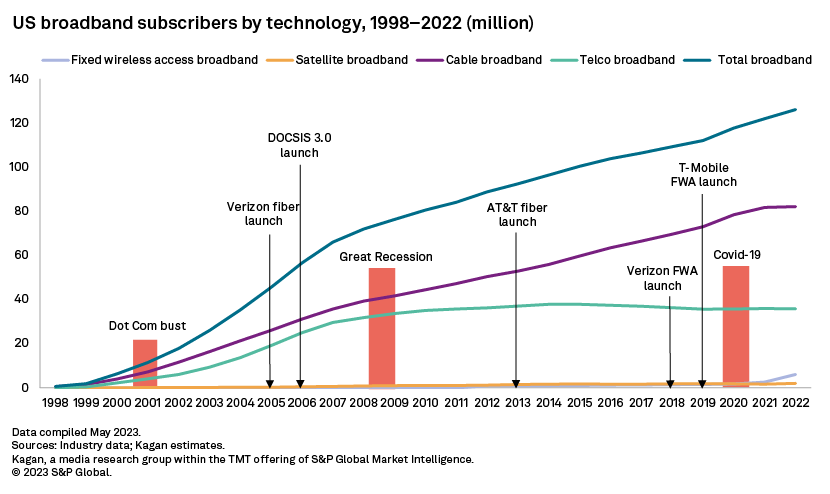
Cable (including Comcast Corp., Charter Communications Inc., Altice USA Inc., WideOpenWest Inc., Cable One Inc. and others) has dominated US broadband's 25-year existence. About two thirds of all broadband subs had cable modems (82.1 million) at the end of 2022.
Telco subs (including AT&T Inc., Verizon Communications Inc. Frontier Communications Parent Inc., and others) started plateauing in 2007 south of 40 million as legacy copper phone companies started losing DSL subs at roughly the same rate that they were adding new fiber subs.
Satellite broadband subs (Viasat Inc. EchoStar Corp. and Space Hellas SA's Starlink) have lingered in the 1 million to 2 million subscriber range since 2008 but finally broke above 2 million last year due largely to growth at Low Earth Orbit new entrant Starlink.
While fixed wireless similarly had trouble breaking above 2 million subscribers for years, its recent surge, driven by T-Mobile US Inc. and Verizon, helped it surpass 6 million last year.
The three recessions since 1998 have had a mixed impact on growth. The 2001 dot com bust was not enough to slow home additions as the industry enjoyed its early "hockey stick" growth. The housing bust of 2007-2009 saw a meaningful decline in net adds from 10 million+ annually in 2005 and 2006 to about half that annual rate from 2007-2009. And the short 2020 COVID-19 recession boosted net adds driven by shelter-in-place home offices.
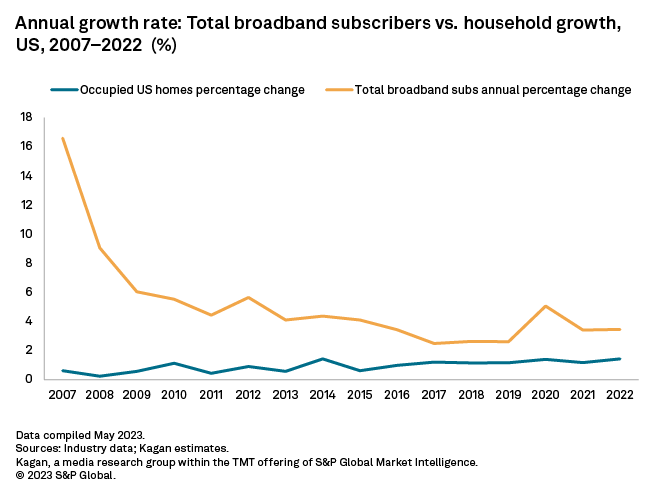
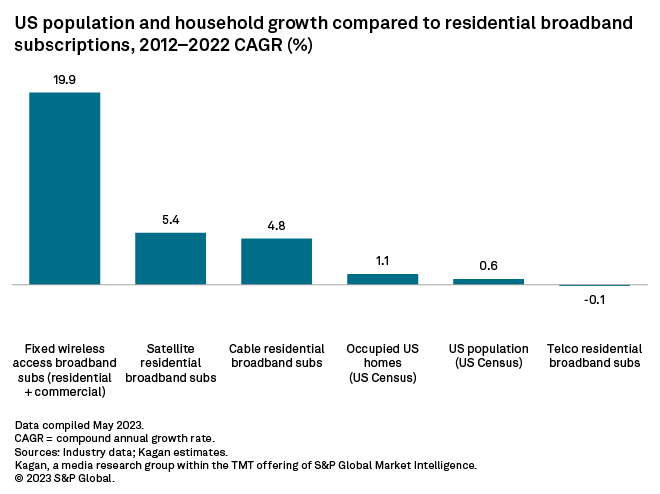
Looking just at residential subscriptions over the last 10 years, all broadband technologies outpaced home and population growth, except for telco. Total broadband homes have tripled the rate of home growth since 2012.
Fixed wireless subs managed the strongest 10-year compound annual growth rate (CAGR) at 19.9% thanks to recent entries from T-Mobile (2019) and Verizon (2018). Satellite at a 5.4% CAGR grew the second fastest boosted by the new low earth orbit operator Starlink (2021). Cable subs were up at a 4.8% CAGR while telco treaded water at 0%. By comparison, new homes grew at 1.1% annually with population up 0.6% per year.
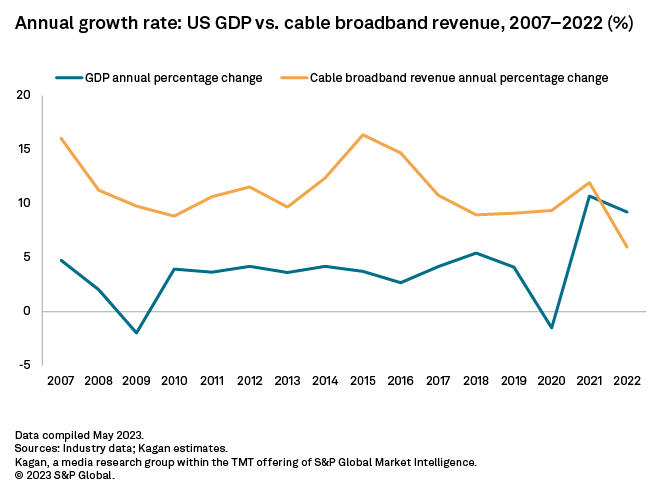
Cable broadband revenue topped $76.60 billion in 2022 and has grown at a higher annual clip than the overall economy (GDP) for years, except last year when fixed wireless started luring away customers.
Telco ranks second by revenue at $30.05 billion in 2022, followed by satellite and fixed wireless, both around $2.5 billion annually.
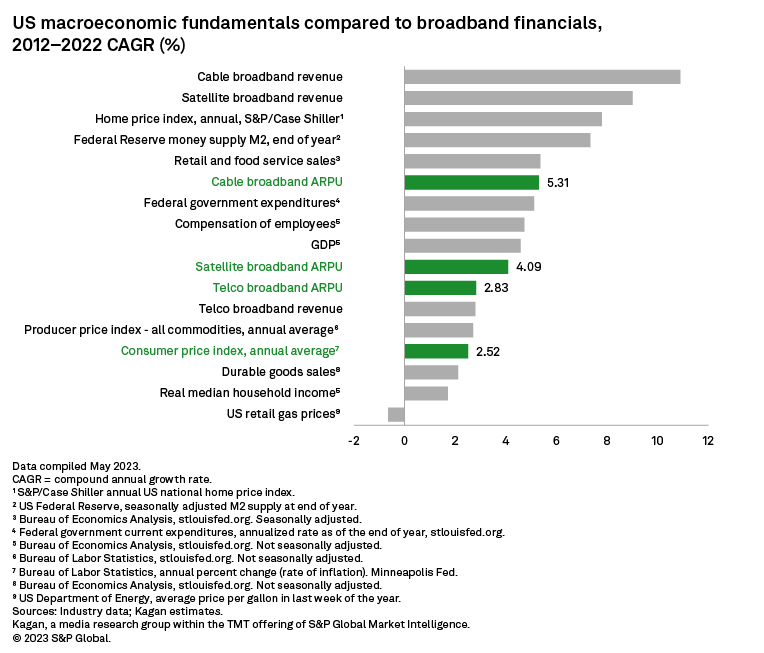
Over the last decade, cable operators had the strongest price controls of the group with cable broadband average revenue per unit more than double the US CPI CAGR of 2.5%. Satellite was up with a CAGR of 4.1% while telcos have also managed to beat CPI growth since 2012.
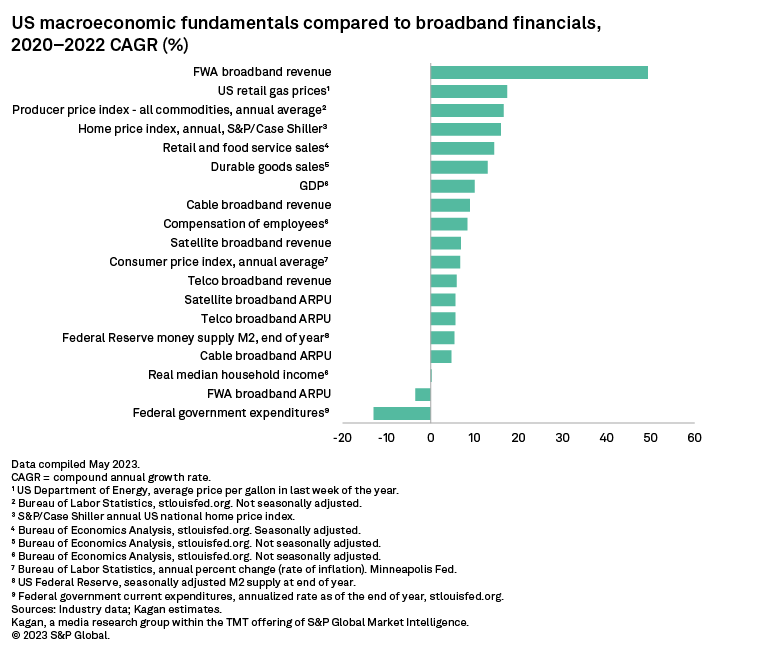
But looking back in the three years since COVID-19 altered lives, fixed wireless topped the chart in terms of top-line growth, logging a revenue CAGR of 58.5%.
Only two of our historical line-items logged a decline since 2020. Federal expenditures shrank at an average of 13% per year as government spending cooled off as pandemic-related economic woes faded. And fixed wireless ARPUs dropped an estimated 3.5% as both T-Mobile and Verizon Wireless competed aggressively for cable subscribers. For instance, Verizon's 5G Home offers rates as low as $25 per month for its mobile phone subs in some markets, just a third of the 2022 cable broadband ARPU ($77.94).
Going forward, growth will be slower compared to broadband's first 25 years. But helping close the digital divide over the medium term will be the more than $40 billion in funds coming from the Broadband, Equity Access and Deployment program.
Multichannel Trends is a regular feature from Kagan, a media research group within S&P Global Market Intelligence's TMT offering, providing exclusive research and commentary.
This article was published by S&P Global Market Intelligence and not by S&P Global Ratings, which is a separately managed division of S&P Global.

