S&P Global Offerings
Featured Topics
Featured Products
Events
S&P Global Offerings
Featured Topics
Featured Products
Events
S&P Global Offerings
Featured Topics
Featured Products
Events
Banking & Capital Markets
Economy & Finance
Energy Transition & Sustainability
Technology & Innovation
Podcasts & Newsletters
Banking & Capital Markets
Economy & Finance
Energy Transition & Sustainability
Technology & Innovation
Podcasts & Newsletters
S&P Global Offerings
Featured Topics
Featured Products
Events
Quantamental Research — 27 Mar, 2023
By Temilade Oyeniyi and Samrudhi Kaulapure
Highlights
Regional bank stocks have taken a hit in the market sell-off following the collapse of Silicon Valley Bank, with month-to-date losses of 28% versus 0% for the S&P 500.
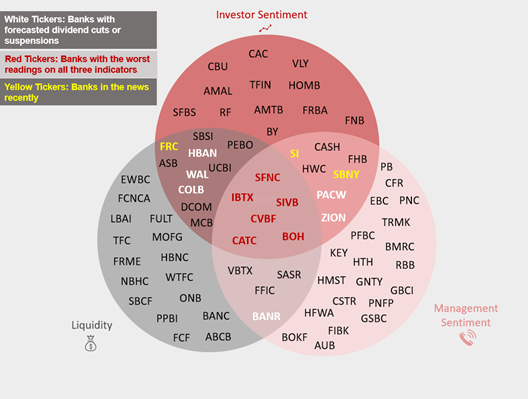
This report introduces a screen to help both equity and fixed income investors identify firms with unfavorable exposures to liquidity, management sentiment, and investor sentiment.
The collapse of Silicon Valley Bank (SIVB) led to a reassessment of liquidity and contagion risks across the banking industry. Regional banks have borne the brunt of the subsequent market sell-off. Month-to-date, regional bank stocks are down by 28%, versus 0% for the S&P 500.[1] This report introduces a screen to help both equity and fixed income investors navigate the current volatility in the banking industry. The screen identifies regional banks with unfavorable exposures to three fundamental and sentiment indicators:
Figure 1: Stock Tickers of U.S. Regional Banks with the Worst Readings across Liquidity, Management Sentiment, and Investor Sentiment Indicators

Source: S&P Global Market Intelligence Quantamental Research. Data as at 03/16/2023.
Liquidity data based on 2022 Q4 financials.
Explore the datasets used to conduct this research:
Textual Data Analytics (TDA)
TDA is a suite of 800+ predictive and descriptive signals derived from earnings call transcripts.
Securities Finance Data
Market leading analytics on short seller demand, supply and borrow costs. Comprehensive daily and intraday data on global equity and fixed income securities lending flows.
SNL Data
Database of over 50,000 public and private companies (30,000 active), spanning all markets globally.
Dividend Forecasting Data
Independent dividend amount and date estimates for 28,000+ global companies, ADRs and ETFs up to five years in the future.
[1] The bank index used for this analysis is the Dow Jones U.S. Select Regional Banks Index. Data as at 3/21/2023
Read the Full Report
