Featured Topics
Featured Products
Events
S&P Global Offerings
Featured Topics
Featured Products
Events
S&P Global Offerings
Featured Topics
Featured Products
Events
S&P Global Offerings
Featured Topics
Featured Products
Events
Financial and Market intelligence
Fundamental & Alternative Datasets
Government & Defense
Professional Services
Banking & Capital Markets
Economy & Finance
Energy Transition & Sustainability
Technology & Innovation
Podcasts & Newsletters
Financial and Market intelligence
Fundamental & Alternative Datasets
Government & Defense
Professional Services
Banking & Capital Markets
Economy & Finance
Energy Transition & Sustainability
Technology & Innovation
Podcasts & Newsletters
PUBLICATION — Nov 16, 2021

By Gavan Nolan
Valuing less liquid assets is challenging even in the best of times, but in stressed periods such as March 2020, it can seem a herculean task. Volatility is extreme, what little liquidity that exists evaporates and hitherto sparse observable data is absent without leave.
Given the potential impact on end investors, it's no surprise that regulators are scrutinising how asset managers tackle the thorny issue of less liquid asset valuation. In November 2020, ESMA published a report that identified areas where investment funds could improve their readiness for future adverse shocks. One such area (the majority were related to liquidity - a topic for our next post) was the valuation of funds with significant exposure to corporate debt. Notably, ESMA stated that management companies should ensure "a sustainable approach in case of extended periods of market stress and eventually - where needed - adapt their valuation model".
ESMA is not the only regulator scrutinising the valuation of corporate debt. The Bank of England and the FCA published a report on liquidity management in UK open-ended funds. The report, based on a survey of 272 funds investing in less liquid assets, asked funds to assess the liquidity of their corporate bond holdings along with the degree of valuation certainty. The Bank/FCA concluded that funds routinely overestimate the liquidity of their holdings in stressed conditions and concurrently the certainty of their valuations.
A plethora of implications arise from this regulatory scrutiny, many of which of we will explore in future posts. But the topic of less-liquid valuations - while not new - is of increasing importance in the current climate and merits further investigation.
Fixed Income Curves
Compared to the tumultuous times of 2020, financial markets in 2021 have been positively placid - inflation concerns notwithstanding. But though volatility is low and credit has traded in a tight range, idiosyncratic risk is still emerging. Leveraged buyouts - an omnipresent feature of pre-GFC credit markets - have returned to the fray. A wall of money - buyout firms sitting on $1.6 trillion in cash (Preqin) - low rates and easy financing conditions have set the scene for LBO activity.
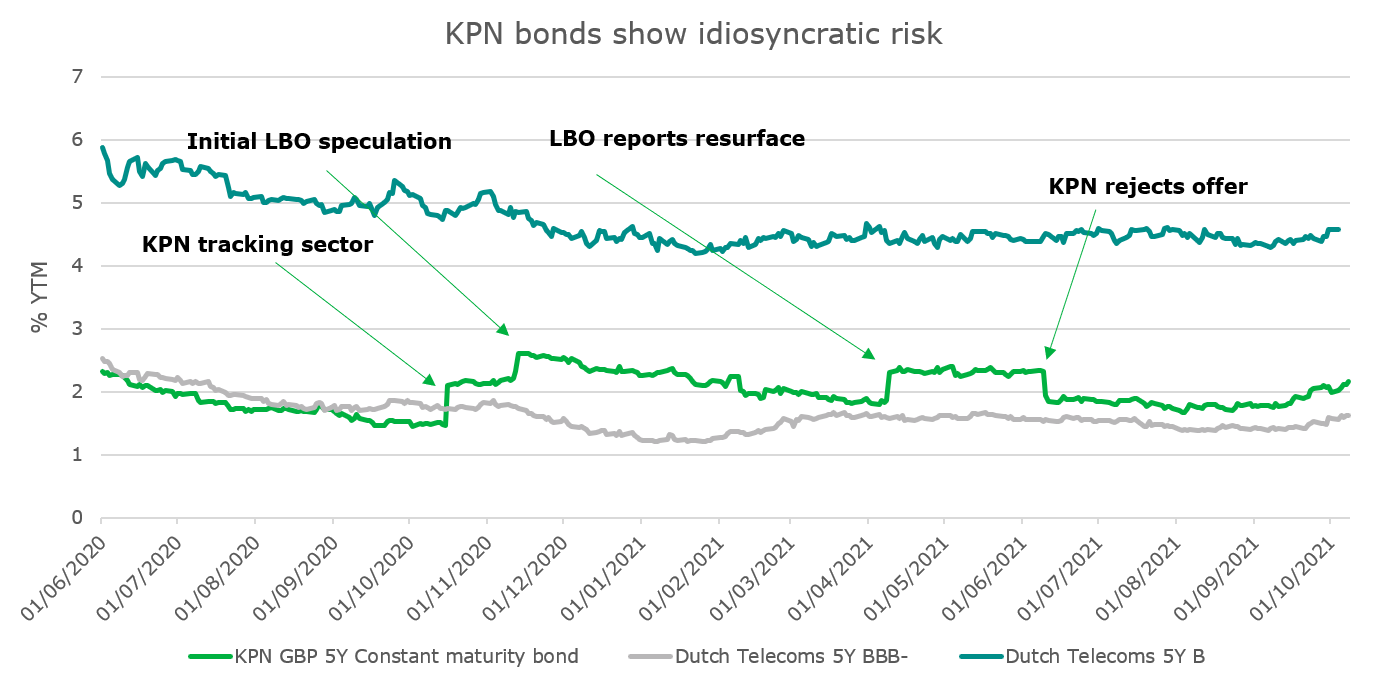
Some of these deals have been agreed upon, for example, the $30bn acquisition of Medline. Others are still speculation. Dutch telecoms firm KPN falls into the latter bracket. Reports surfaced in April that two private equity firms were preparing a joint bid. This would inevitably increase the debt burden of KPN, so naturally, the credit spreads of KPN bonds widened sharply.

Chart 1 (Source: IHS Markit)
Chart 1 shows that KPN's 5-year constant maturity yield (demonstrated using IHS Markit issuer curve) was broadly in line with its peers in the Dutch telecoms sector (as shown by the IHS Markit Netherlands 5-year BBB- bond sector curve) for most of 2020. But there is a clear divergence in October 2020, when reports first emerged that KPN was a target for buyout firms. It traded consistently wider than the sector during Q4 2020 and Q1 2021 before converging once again. Then its yields and credit spreads shot up in April when LBO reports reemerged, though yields subsequently fell when KPN rejected the advances of private equity.
It's important to note that though KPN's credit spreads rose by a material amount due to the LBO speculation, they were never close to Single B levels (IHS Markit Netherlands 5-year B bond sector curve). LBOs often result in the target firm ending up in single B territory, which suggests that the market priced in a relatively low - though not insignificant - probability of the deal succeeding.
In the case of KPN the market was proved right - the efforts to take it private failed. But buyout firms are not easily rebuffed and their advances are often welcomed by shareholders. UK supermarket group Morrisons was recently acquired by a private equity group and ASDA was bought last year, prompting LBO speculation across the sector. Sainsbury is widely seen as a potential target, leading to perceived credit deterioration.
Sainsbury is not a typical credit, however. It doesn't have any senior unsecured bonds outstanding since it refinanced through securitisation in 2006. This means that investors looking to value or risk manage Sainsbury exposure have to look beyond issuer yield curves. One alternative is to use CDS curves. This may seem counterintuitive given that Sainsbury won't have any current reference obligations (due to the lack of unsecured bonds). But CDS can, and do, trade on such names in the expectation that there will be future debt issuance.
Chart 2 shows Sainsbury's 5-year CDS spread tracking the BBB Europe CDS sector curve very closely until LBO speculation emerged in June. Its spreads then widened sharply, reaching a level of 135bps at the time of writing. This puts it at a level closer to a BB credit, as demonstrated by the relevant sector curve (IHS Markit gives it an implied rating of BB).

Chart 2 (Source: IHS Markit Price Viewer)
CDS is certainly a worthy input into a less liquid valuation framework. But CDS spreads contain basis to cash instruments and of course, are a pure measure of credit risk, rather than an all-in measure such as yield to maturity. Some investors may prefer to use bond or loan sector curves in such cases.

Chart 3 (Source: IHS Markit Price Viewer)
Take Toshiba Corp, for example. The Japanese conglomerate is based in a jurisdiction traditionally unfriendly to approaches from buyout firms. Nonetheless, after a series of accounting scandals, the company has found itself on the radar of private equity. This leaves institutions with credit exposure to Toshiba facing a valuation challenge if their assets are less liquid and vulnerable to credit deterioration amid LBO speculation.
Toshiba, in fact, doesn't have any senior unsecured bonds outstanding but still has credit ratings (S&P BB+, R&I BBB, JCR BBB+) due to its long-term debt liabilities. These are mainly in the form of term loans and leases (off-balance sheet). The idiosyncratic risk is evident in Toshiba's CDS, where five-year spreads widened sharply in April when the speculation first emerged (incidentally, this is another example of a CDS contract with no active reference obligation).
From a valuation angle the use of a bond issuer yield curve is off the table due to the lack of senior unsecured bonds (unless a comparable issuer curve is used). That leaves sector curves as the next best option. In the case of Toshiba, any credit exposure will probably be through term facilities (either directly or via the secondary markets), so a loan sector curve would be applicable.
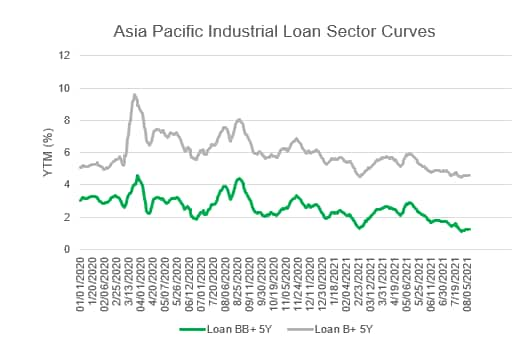
The chart below shows Asia-Pacific Industrial Loan sector curves and the basis between BB+ and B+ gives an idea of the impact on yields from a LBO driven rating downgrade. Investors can choose applicable liens and account for covenant-lite lending. Of course, the economics of each buyout are different and depend on the transaction details and the intentions of the acquiring firm. Investors have to make their own analysis of the likely balance sheet impact of the buyout and the consequent sector curve to use in the valuation.

Chart 4 (Source: IHS Markit)
The chart shows 5-year yields for APAC Industrial loans. LBOs (whether mooted or executed) tend to steepen the credit curve by pushing the probable increased refinancing risk out by a few years. But if investors want to see the impact on the shorter-end of the curve (due to a probable call of the loan) the full term structure of the curve from three-months to 30-years is available.
Valuation - Governance, Process and Data
We've seen that event risk - in the form of LBOs or other events - can pose considerable valuation challenges for investment firms holding less liquid debt instruments. This area has come under increased regulatory scrutiny following the market dislocations in 2020 and is set to remain a high priority. Asset managers need to ensure that they are equipped with the necessary governance, processes and datasets to meet the demands of regulators. Illiquid assets - such as private debt and unlisted equity - may require an analyst-driven approach to valuation where robust bottom-up models are constructed. This approach will also incorporate the idiosyncratic elements of the illiquid asset. For less-liquid assets in fixed income, high quality issuer and sector curves are an important part of the valuation toolkit.
Posted 16 November 2021 by Gavan Nolan, Executive Director, Business Development and Research, Fixed Income Pricing, S&P Global Market Intelligence
S&P Global provides industry-leading data, software and technology platforms and managed services to tackle some of the most difficult challenges in financial markets. We help our customers better understand complicated markets, reduce risk, operate more efficiently and comply with financial regulation.
This article was published by S&P Global Market Intelligence and not by S&P Global Ratings, which is a separately managed division of S&P Global.