


Research — Oct 16, 2024
Radio/TV station annual outlook, 2024


This article is part of the broadcast TV and radio station forecast series, which also includes:
– US TV and radio station ad projections 2024–2034
– US TV station retrans and reverse retrans projections 2023–29 — to be released in October
– Complete picture of US TV station industry revenue, 2009–29 — to be released in October
The US broadcast station industry is forecast to reach $36.19 billion in total advertising revenue in 2024, up 9.3% from $33.10 billion in 2023, primarily from the influx of record political ad spending in a presidential election year. Core ad categories, including automotive, retail and travel, have continued to see softness due to high interest rates and inflationary pressures dampening consumer spending on big-ticket items. Pharmaceuticals, telecom and professional services continue to outperform other ad categories.
The local ad market continues to be stronger than the national side of the spot ad business for broadcast stations with their ties to the local community. Ad agencies and major brands are shifting budgets to digital native platforms as content shifts from linear to streaming. S&P Global Market Intelligence Kagan's 2024 projection shows $24.95 billion from TV stations — including core national and local spot, political and digital/online — and $11.24 billion from radio stations, which includes national and local spot and digital, excluding network and off-air.

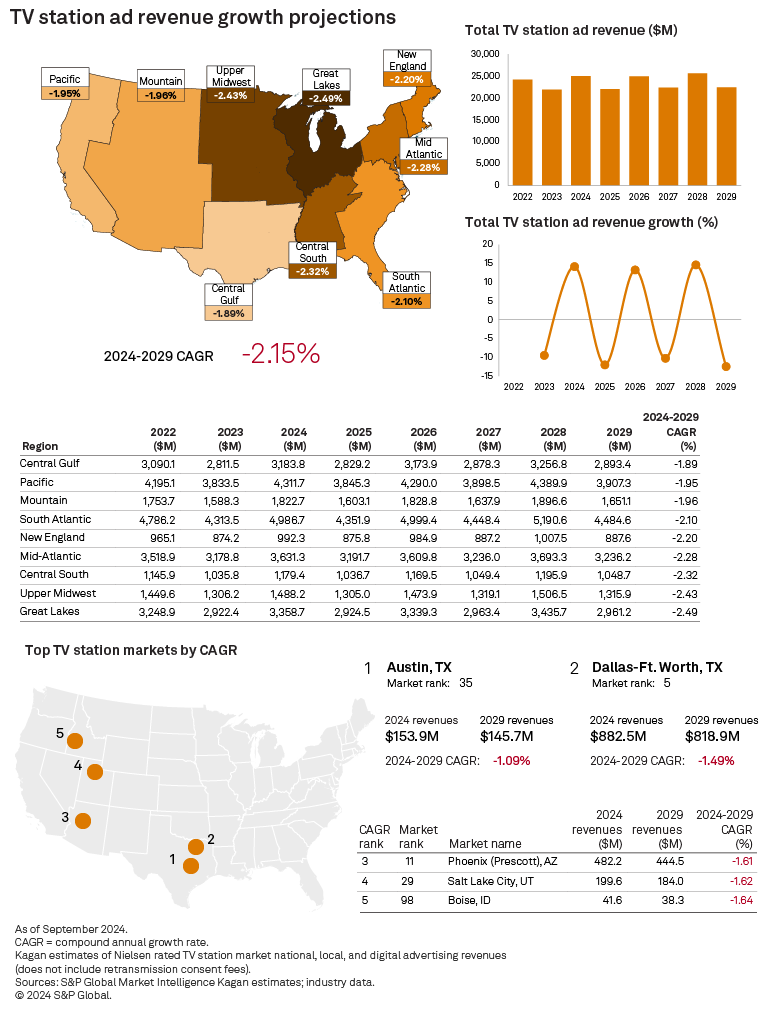
TV station core local and national ad revenue in 2024 is expected to decline slightly at 0.3% to $17.58 billion, with local spot up 1.5% and national spot down 4.5%, while digital could climb 3.0%. With the influx of $4.09 billion in political ads in a presidential election year, the total TV station ad revenue is expected to grow 14.1% to $24.95 billion.
TV station ad revenue over the next five years is projected at a negative 2.1% compound annual growth rate (CAGR), hitting a high of $25.57 billion in 2028, and then dipping 12.5% to $22.39 billion in the 2029 nonelection year. This five-year CAGR is lower than the 2023 outlook, given it starts in a presidential election and Summer Olympics year in 2024 and ends in a nonelection year in 2029. Over the 2024–2029 projection period, the core national spot ad market for TV station owners is expected to decline by 5.0% CAGR and local spot will be up 1.5% CAGR, while the ebbs and flows of political ad spending in election years are reflected in the peaks and valleys of total TV station ad revenue.
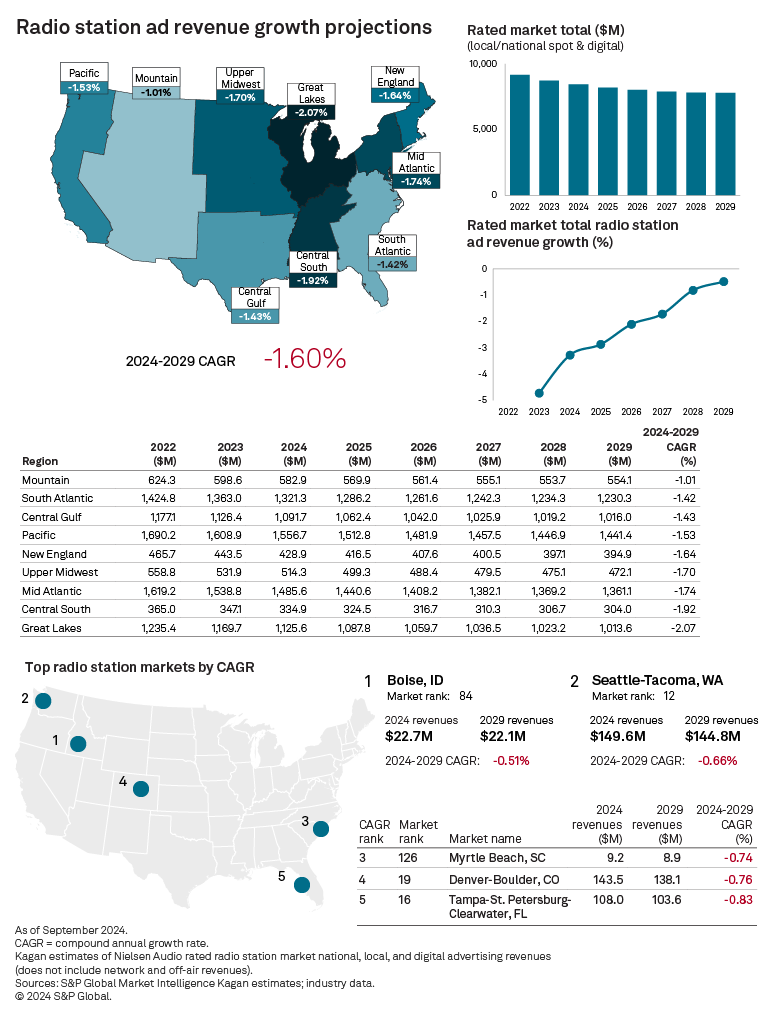
The radio station industry's five-year ad outlook, driven more by the local market and less political ad uptick, is expected to decline 3.7% in 2024 to $11.24 billion, excluding network and off-air revenue. As radio advertising continues to shift to streaming audio and podcasting alternatives, we expect declines in the national spot of 5.0% CAGR and the local spot of 3.6% CAGR, as digital ad growth of 5.9% CAGR offsets larger declines with total radio ad revenue contracting to $10.08 billion by the end of the projection period in 2029.

Access our Radio/TV Station Annual Outlook 2023 edition's Excel data supplement.
TV station ratings have been flat to down so far in 2024, as consumers continued to shift from linear to streaming video platforms, although local news and live sports have remained appointment viewing.
Note: TV station ratings from Comscore do not include live station streams on virtual multichannel video programming distributors or the station's own mobile apps or connected TV distribution strategies.
Over the five-year projection period of 2024–2029, political advertising will be spent disproportionately on local stations in swing-state markets and those with higher expected population growth — Arizona, Colorado, Florida, Georgia, Idaho, Montana, Nevada, North Carolina, South Carolina, Texas and Utah — which are forecast to rise more than the national average.
Spending in the 2024 presidential election year is expected to surpass prior records, with Kamala Harris vs. Donald Trump raising hundreds of millions in campaign funds. Political ad spending on US Senate, gubernatorial and congressional district races are also expected to exceed prior elections, in addition to the presidency. Political ad spending on TV stations is expected to reach $4.09 billion, up 14.1% from the last presidential election year in 2020.
Our five-year forecast for TV stations considers the oscillations between even/election and odd/nonelection years and calls for $3.81 billion in the next midterm election year 2026, and $4.33 billion in the following presidential election year 2028.
By the end of the projection period in 2029, we expect the total TV station advertising revenue to reach $22.35 billion, including $17.62 billion in national and local core spot, $1.04 billion in political and $3.69 billion in digital/online revenue.
Based on our TV market-level ad projections, the top five fastest-growing or least-declining US markets by 2024–2029 CAGR are Austin, Texas, at negative 1.09%; Dallas-Ft. Worth, Texas, at negative 1.49%; Phoenix (Prescott), Arizona, at negative 1.61%; Salt Lake City, Utah, at negative 1.62%; and Boise, Idaho, at negative 1.64%.
Radio ads are predominantly local and focus on the auto, retail, travel and entertainment categories, which have been impacted by higher interest rates and price inflation, primarily from higher labor and operating costs. In addition, radio's smaller share of political ad revenue compared to TV makes it more reliant on core ad trends and the auto and retail categories that have been challenged and shifted ad budgets to digital native alternatives.
Radio station owners are fighting for listeners and relevance among satellite radio, streaming music and podcasting options from Amazon.com Inc., Apple Inc., Spotify Technology SA, Sirius XM Holdings Inc. and Pandora Media LLC. Radio listenership has been declining with fewer commuters during prime in-car radio time. Another challenge for radio is new autos, specifically electric vehicles and hybrids, that deprioritize AM/FM in the dashboard and, in some cases, lack an AM antenna.
National radio spot ad revenue is forecast to decline 6.0% to $1.81 billion in 2024 and decline 5.8% to $1.71 billion in 2025. The decline is between 5.3% to 4.3% over the remaining years in the forecast period to $1.41 billion by 2029. Radio's core local spot ad market is projected to contract less at 5.0% to $7.81 billion in 2024, decline 4.8% in 2025, down 4.0% in 2026 and then slightly fall 3.8% to 2.5% over the remaining forecast period to $6.52 billion by 2029.
Radio station owners are investing in streaming, podcast and digital marketing service initiatives, with digital revenue expected to rise 6.4% in 2024 to $1.62 billion, 6.3% in 2025 to $1.72 billion and range between 6.1% to 5.7% growth through the rest of the projection period to $2.16 billion in 2029. Off-air is forecast to grow 3.3% in 2024 to $2.34 billion and 3.1% in 2025 to $2.41 billion, with live events, a growing segment for the radio industry, reaching $2.68 billion by the end of 2029.
Radio's lower ad cost, local audience and relatively high return on investment compared to other media are its strengths, while digital investments point to future growth opportunities, with the national and local spot ad market for radio expected to decline over the forecast period.
Between 2024 and 2029, we expect radio station local and national spot ad revenue, including digital, to decline at a CAGR of 1.60% in rated markets, with non-rated markets declining at a negative 3.89% CAGR.
Total radio revenue, including national and local spot, digital, off-air and network revenue, is expected to decline slightly at a five-year negative CAGR of 1.45% from an estimated $14.42 billion in 2024 to $13.40 billion by the end of 2029.
Based on our radio market-level ad projections, the top five fastest-growing or least-declining US markets by 2024–2029 CAGR are Boise, Idaho, at negative 0.51%; Seattle-Tacoma, Washington, at negative 0.66%; Myrtle Beach, South Carolina, at negative 0.74%, Denver-Boulder, Colorado, at negative 0.76%; and Tampa-St. Petersburg-Clearwater, Florida, at negative 0.83%.
Methodology
In this report, we present five-year revenue projections for each of Nielsen Holdings PLC's 210 US TV Designated Market Areas for 2024–2025 and 243 Nielsen Audio-rated radio markets as of Spring 2024. Our market-by-market projections use multiple factors to calculate growth rates.
For TV, these analysis factors include household growth rates in each of the TV market areas, as provided by Nielsen, in conjunction with estimates for political revenue, Olympic Games and World Cup viewership, overall US demographic and consumer trends and additional ad revenue opportunities through digital multicasting and station streaming. We also incorporate data related to mobile initiatives and changes in local economic factors.
For radio, individual market projections are based on estimated population growth in each core-based statistical area, as provided by Nielsen. Estimates in the model also reflect market-level economic factors, traditional advertising spending shifting to digital and mobile, as well as recent radio listenership trends.
Median household effective buying income growth, unemployment rate growth and other economic statistics from Nielsen are used in our projection model, as well as individual broadcasters' information when available. Additionally, both TV and radio revenue are in part, based on Kagan's revised 10-year projections for TV and radio, as of September.
In our report data, the market revenue data for both TV and radio are sorted alphabetically by revenue growth and market rank. Additionally, the revenue growth data is presented regionally, covering the Pacific, Central Gulf, Mountain, Upper Midwest, mid-Atlantic, South Atlantic, New England, Great Lakes and Central South regions.
Use Kagan's Broadcast Station Database template to quickly view a station owner's operating metrics by station, market share and net ad revenue. If you don't have our Excel Add-In, please download it here.
Broadcast Investor is a regular feature from S&P Global Market Intelligence Kagan.
This article was published by S&P Global Market Intelligence and not by S&P Global Ratings, which is a separately managed division of S&P Global.