S&P Global Offerings
Featured Topics
Featured Products
Events
S&P Global Offerings
Featured Topics
Featured Products
Events
S&P Global Offerings
Featured Topics
Featured Products
Events
Banking & Capital Markets
Economy & Finance
Energy Transition & Sustainability
Technology & Innovation
Podcasts & Newsletters
Banking & Capital Markets
Economy & Finance
Energy Transition & Sustainability
Technology & Innovation
Podcasts & Newsletters
S&P Global Offerings
Featured Topics
Featured Products
Events
Blog — 13 Feb, 2023
In our ongoing discussions with clients, we confirmed that inflation, rises in energy and commodity prices, interest rate hikes, real estate price drops, geopolitical tensions, supply chain disruptions and a slowing global economy are areas on people's radar screens going into 2023.
This blog series “In Search of Resilience" attempts to shed light on data-driven insights and solutions to find resilience during these volatile times.
In this first installment, we look in the rearview mirror to see how industry groups held up during 2019-2020, the beginning of the COVID-19 pandemic, highlighting two groups:
As shown in Table 1, we focus on content sets and metrics that are specifically designed for aggregations and can serve as proxies for industry group factors. For example, the CreditPro® dataset, which provides a comprehensive picture of credit risk exposures with access to default, transition and recovery data, embeds business rules that remove related entities to avoid double counting a single company's influence on country and industry group averages of default and ratings changes. The data also ensures that entities included in the sample are those where the credit ratings changes reflect those of the industry group tagged to the entity (e.g., by removing data where the ratings changes are mostly driven by parent/holding companies from completely different industry groups). Hence, we consistently use the CreditPro® coverage universe for our aggregated analyses throughout this study.
Table 1: Sample list of data and metrics used to assess Industry group-level resilience
|
S&P Global Ratings content |
Data point |
Metrics |
|
Issuer Credit Ratings (CreditPro) |
Upgrades and Downgrades – full sample and speculative-grade rated entities |
Quarterly % of Upgrades versus Downgrades and Defaults |
|
Issuer Credit Ratings (CreditPro) |
Defaults – full sample and speculative-grade rated entities |
Quarterly Default Rates |
|
Issuer Credit Ratings (RatingsXpress® Credit Ratings History) |
% of CreditWatch positive minus CreditWatch negative |
|
|
Issuer Credit Ratings (RatingsXpress Credit Ratings History) |
Outlook |
% of Outlook positive and Outlook stable minus Outlook negative |
|
RatingsXpress Scores and Factors History |
Corporate Industry Country Risk Scores (CICRA) |
Average of CICRA within an Industry Group |
|
RatingsXpress Scores and Factors History |
Industry risk Scores |
Average of Industry risk Scores within an Industry Group |
|
RatingsXpress Scores and Factors History |
Cash Flow and Leverage Scores |
Average of Cash Flow and Leverage Scores |
Source: RatingsXpress Scores and Factors, RatingsXpress Credit Ratings History and CreditPro. From S&P Global Market Intelligence. As of January 2023.
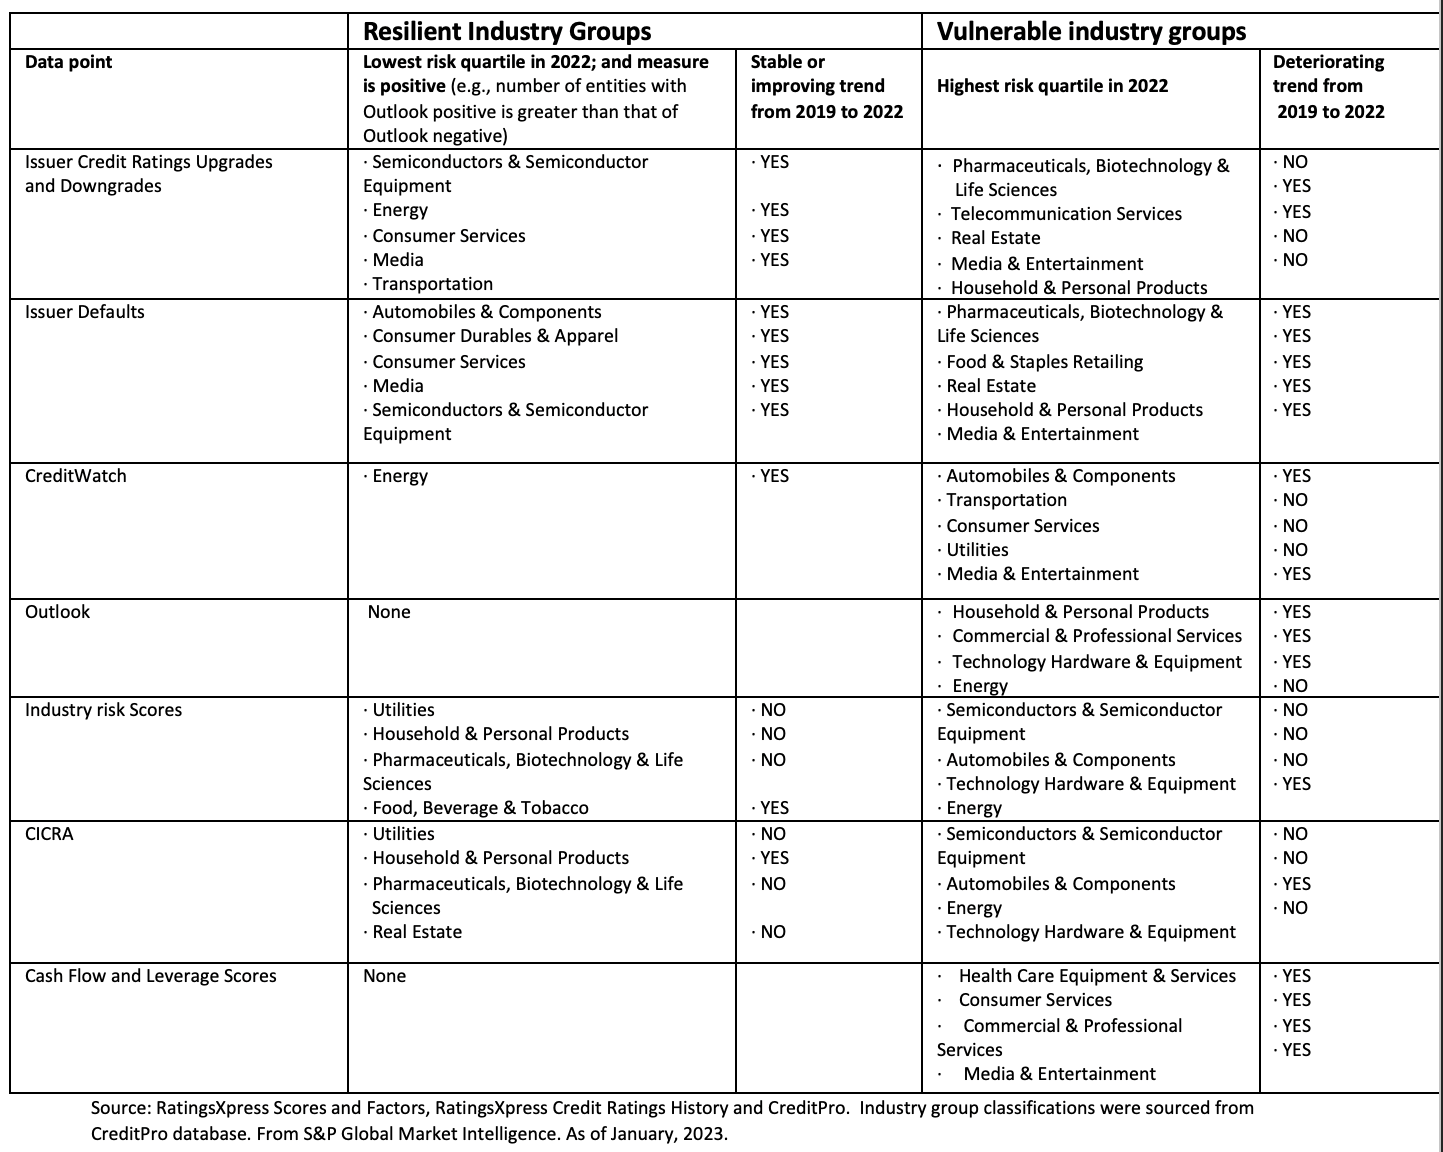
Table 2 displays Resilient and Vulnerable industry groups. The Resilient industry groups in green were in the best (lowest) risk quartile in 2022, with no increase in the trend from 2019 to 2022. Additionally, the measure should be positive (e.g., the percent of outlook positive exceeds that of outlook negative). The Vulnerable industry groups in red were in the worst (highest) risk quartile in 2022, with a worsening trend from 2019 to 2022.
Table 2: Resilient and Vulnerable industry groups

Looking in the Rear-view Mirror: Ratings Changes and Defaults Trends showed Post COVID Recovery
Credit rating upgrades, downgrades and defaults over the past three years were generally an improvement across industry groups (i.e., 2022 versus 2019) as the economy recovered post-COVID. This was particularly noticeable in cyclical industries, such as Semiconductors, Consumer Services and Energy, while industries such as Real Estate and Telecommunications fared worse.
Forward-looking Views on Outlook and CreditWatch are Trending Negative
On a forward-looking basis, S&P Global Ratings Outlook is trending negatively across nearly ALL industry groups (i.e., the number of entities with negative outlook exceeds the number of entities with positive outlook within these industry groups). Both consumer and business-oriented sectors have unfavorable Outlooks, with Household & Personal Products, Commercial & Professional Services and Technology Hardware & Equipment being the most vulnerable. The only industry group that had Outlook positive exceeding Outlook negative was Semiconductors & Semiconductor Equipment, however, that measure showed a decline from 2019 to 2022.
We saw a similar negative trend for CreditWatch, which deteriorated across most industry groups from 2019 to 2022 except Energy which was mildly positive. Consumer-related industry groups, such as Media & Entertainment, fell into the Vulnerable group, along with Automobiles & Components. Separately, Consumer Services, Utilities and Transportation all had substantially more entities with CreditWatch negative versus CreditWatch positive.
A Look at Credit Rating Drivers
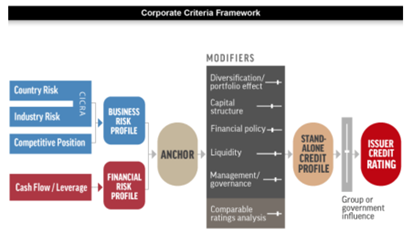
Drilling into the underlying building blocks of credit ratings (i.e., current and historical data for scores and factors) reveals a trend that warrants closer surveillance of industry group sectors.
Trends in scores and factors are key to detect any shifts in credit risk profiles of companies, and often serve as early warnings of changes in credit ratings and foreshadow equity price changes.
Within the context of scores and factors, we focus on data that are linked to systemic risk, such as industry risk scores and CICRA scores, as these also apply to entities that are not rated by S&P Global Ratings.
Figure 1: Corporate Credit Ratings Framework
Source: Guidance | Criteria | Corporates | General: Corporate Methodology, RatingsDirect®, November 19, 2013. For illustrative purposes only.
Industry risk: A Mixed Bag
Drilling into the underlying components of a credit rating shows that even defensive industry groups, such as Utilities, showed evidence of worsening industry risk. Food, Beverage & Tobacco and Household & Personal Products showed mixed evidence on industry risk.
On the flip side, the heightened volatility in Oil & Gas prices and supply chain issues resulted in weak and increasing industry risk for the Energy industry group, which showed the weakest industry risk and CICRA scores that were trending negative from 2019 to the end of 2022.
If changes in industry risk and CICRA are moderatefor most industry groups – where is this ratings downgrade momentum coming from?
Cash flows and Leverage are Red Flags
We look at the second building block towards the anchor, the cash flow/leverage score. This measure also assesses potential default risks in response to possible interest rate hikes combined with slow growth.
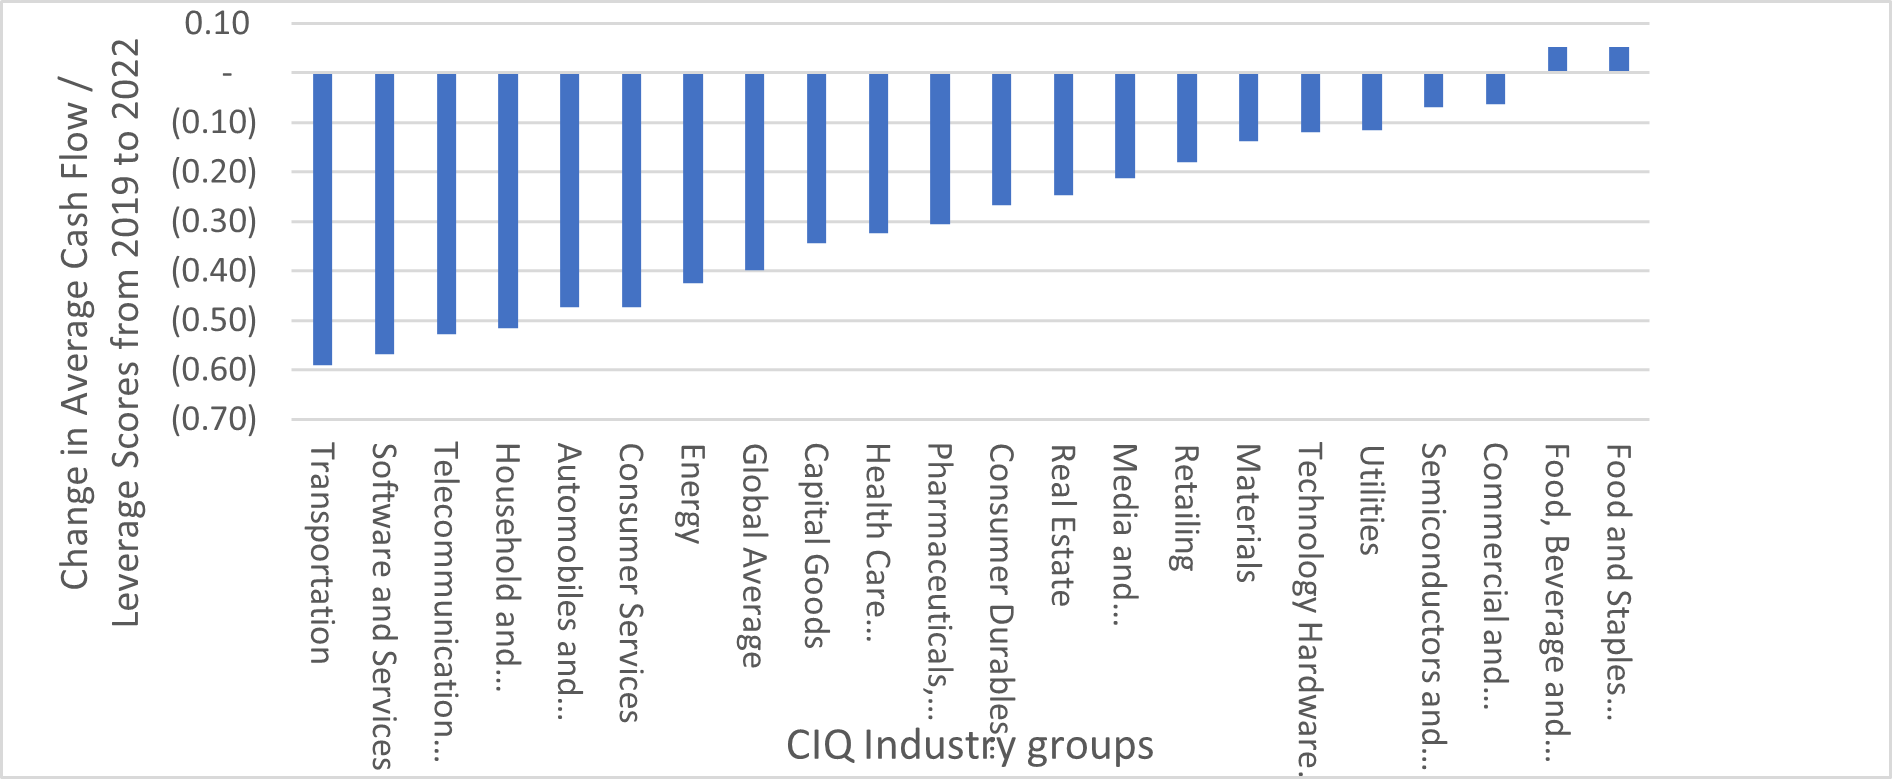
The global average cash flow/leverage scores weakened from 3.9 in 2019 to 4.3 in 2022, with a deterioration in these scores across most S&P industry groups (See Figure 2).
Figure 2: Changes in average cash flow/leverage scores from 2019 to 2022
Source: RatingsXpress Scores and Factors. From S&P Global Market Intelligence. As of January, 2023.
There is a clear trend of weakness across all sectors cutting across both consumer and business sectors, with industry groups that rely on consumers, such as Consumer Services and Media & Entertainment, having the weakest cash flow/leverage scores. Rounding out the bottom four are Health Care Equipment & Services and Commercial & Professional Services.
What Does the Future Hold?
This first installment in the resilience blog series takes a macro view of industry groups using bottom-up aggregated credit risk metrics that are designed to measure industry group systemic risk. These metrics are applicable to industry groups within and outside the S&P Global universe. While we can identify industry groups that are relatively resilient, as well as the weaker links, the overall trend for credit ratings is turning negative and deteriorating for the cyclical industry groups and those with weak current and future cash flow generation in relation to cash obligations.
Close monitoring of how these underlying scores evolve, along with macro scenario analysis and industry group stress testing, will be crucial next steps to find pockets of resilience heading into this year of uncertainty. The next installment of the blog series will look at time-saving automated solutions for assessing credit risk.
Theme
Products & Offerings

