


Research — Feb 27, 2025
IM February 2025 – Exploration activity rises

By Sean DeCoff
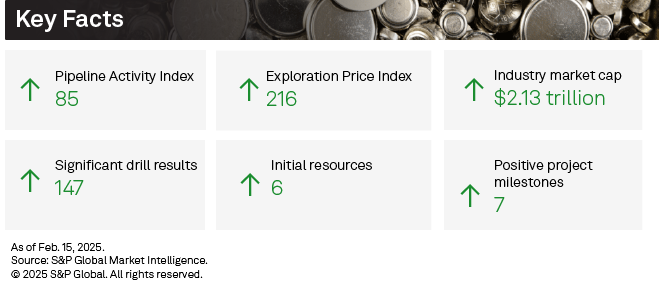
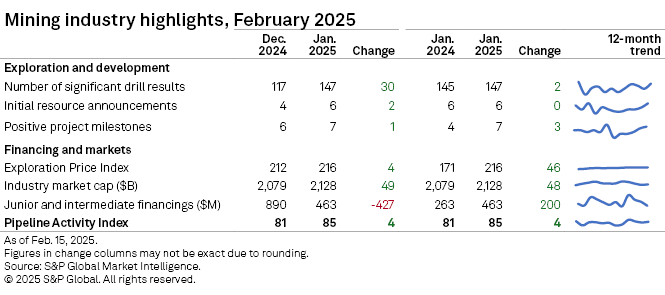
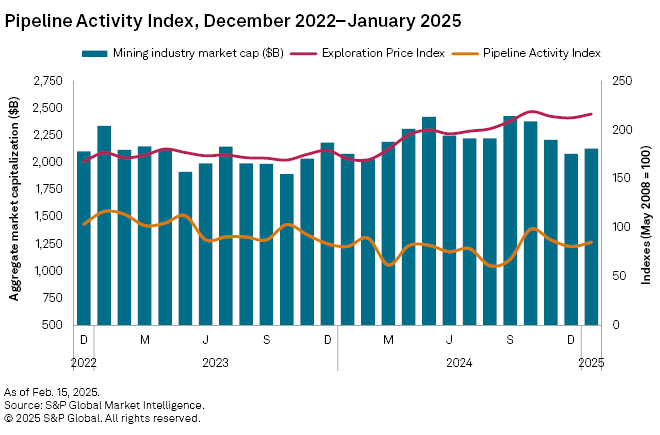
The S&P Global Market Intelligence Pipeline Activity Index (PAI) started 2025 on a strong note, gaining 5% to 85 in January 2025 from 81 in December 2024. The gold PAI rose 8% to 114 from 106, while the base/other PAI was up 3% to 63, compared to 61 in December 2024.
Nearly all the metrics used to calculate the PAI were green in January except for junior and intermediate total financings. The Exploration Price Index (EPI) rebounded, thanks mainly to the strong gold price. Most base/other metal prices continued selling off the month. Mining equities overall were up as a result, with the aggregate industry market cap increasing 2.4%.
The PAI measures the level and direction of overall activity in the commodity supply pipeline by incorporating significant drill results, initial resource announcements, significant financings and positive project development milestones into a single comparable index.
Detailed data on the PAI metrics is available in the accompanying Excel databook.
Fewer transactions push January financings lower
Funds raised by junior and intermediate companies dropped 48% to $463 million, as the number of transactions decreased by nearly 60% to 143, marking the lowest monthly total number of transactions in three years. The number of significant financings, defined as transactions valued at over US$2 million, fell to 31 from 66 in December 2024. Additionally, there was only one transaction valued at over $50 million, down from four in December 2024.
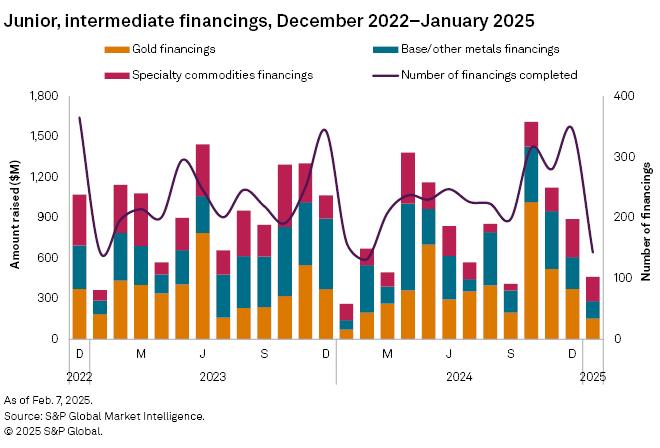
Gold financings declined for the third consecutive month, decreasing by 59% to $153 million. The number of transactions reached a multiyear low of 56. Furthermore, the number of significant financings — defined as transactions over $2 million —more than halved, dropping to 13 from 29 in December 2024. Notably, no transactions were valued at over $50 million, a decrease from one in December.
Funds raised for the base and other metals group declined for the second consecutive month, falling 44% to $130 million. All major targets in this group, led by copper, zinc and silver, decreased. The number of transactions in the base/other metals group dropped by nearly two-thirds to 41, marking the lowest total in three years.
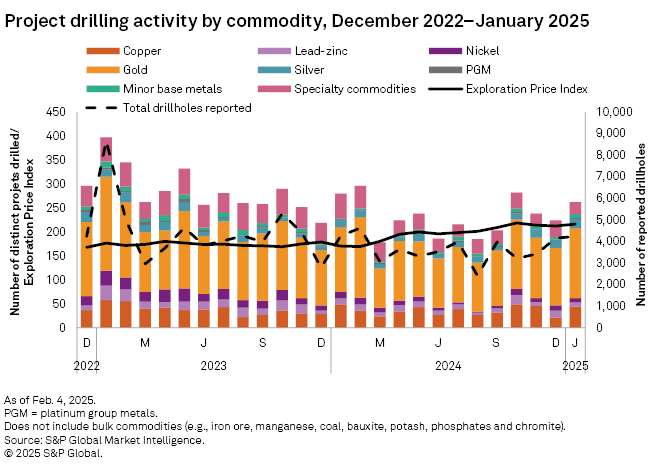
Drilling metrics begin 2025 on strong note
Drilling metrics rebounded in January after a slow end to 2024, with increases across the board. Total projects increased 17% month over month, while reported drillholes were up a marginal 2%. Year over year, projects and drillholes were down 6% and 1%, respectively. Project drilling also increased across all stages of development: Early-stage projects rose 31%, minesite 27% and late-stage 4%.
January's top result came from Toronto Stock Exchange-listed Aya Gold & Silver Inc.'s Zgounder silver and gold mine in Morocco, which reported an intersect of 21 meters grading 2,165 grams of gold per metric ton. The company announced it has achieved a significant milestone, operating above nameplate capacity just weeks after commencing commercial production.
Initial resource up by 2
Six initial resource announcements were made in January: three for gold-focused projects, two for copper projects and one for a silver project.
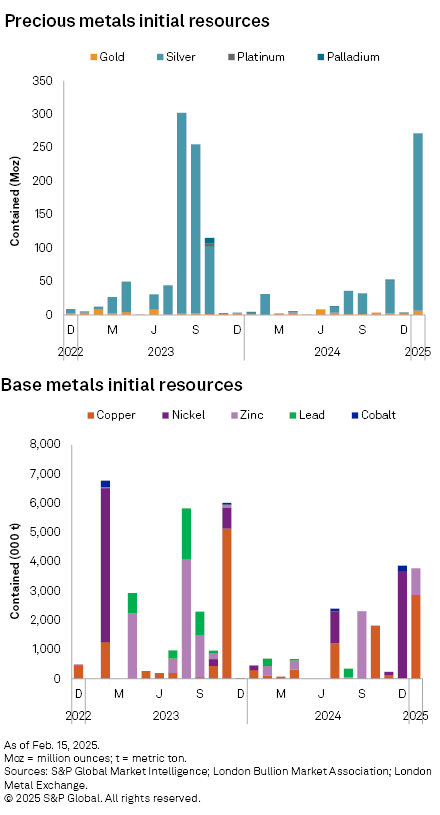
The most notable initial resource announcement came from Minsud Resources Corp. The company announced an initial mineral resource estimate for its Chinchillones Complex deposit, part of the Chita Valley Project in San Juan Province, Argentina. Indicated resources totaled 188 million metric tons at 0.25% copper, 0.11 grams per metric ton gold, and 10.6 g/t silver, containing 466,000 metric tons of copper, 674,000 ounces of gold and 63.5 million ounces of silver. Inferred resources totaled 573 MMt at 0.22% Cu, 0.09 g/t Au and 9.0 g/t Ag, containing 1.244 MMt of copper, 1.65 Moz of gold and 165.6 Moz of silver.
Tintina Mines Ltd. announced an initial mineral resource estimate for its Domeyko Sulfuros copper project located in Chile. The total inferred resource estimate shows 320.6 million metric tons, grading 0.36% copper and 0.255 g/t gold, bringing the total contained copper to 1.16 MMt and gold to 2.62 Moz.
While both announcements were relatively small, two interestingly came from Summa Silver Corp. The company announced mineral resources estimates for its Hughes Silver project in Nevada and for its Mogollon gold-silver project in New Mexico.
Positive milestones rise by 1
Seven positive milestones were registered in January, all of which were for gold-related projects. Five project milestones were production-related, one was related to feasibility and one to preproduction. There were two negative milestones recorded in January.
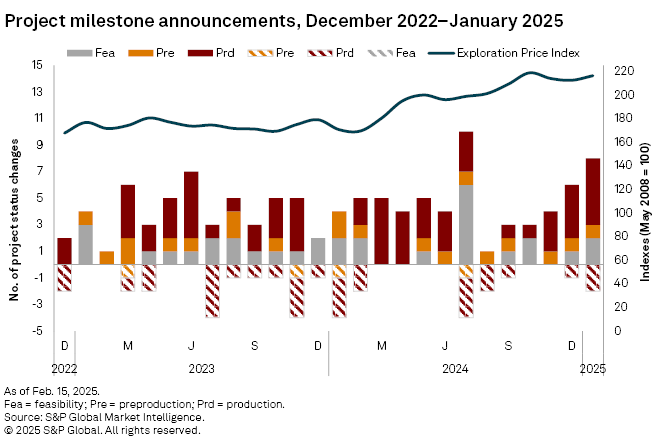
The most notable milestone came from Artemis Gold Inc., which announced the first pour at the Blackwater gold mine in British Columbia. Asante Gold Corp. announced the completion of its definitive feasibility study, which assessed the viability of extending the life of mine for the Bibiani gold mine located in Ghana. On the preproduction side, Alamos Gold Inc. announced the start of construction at the Lynn Lake gold project in Manitoba.
The negative milestone to note came from Barrick Gold Corp., which initiated a temporary suspension of operations at the Loulo-Gounkoto gold complex in Mali as gold shipments continue to be restricted.
Exploration Price Index rises
S&P Global Market Intelligence's EPI continued to rebound in January, coming in at 216, compared with 212 in December 2024. The gold average was up 2.5% month over month, platinum was up 1.3%, and silver was essentially flat. Copper was up 0.6%, while nickel was down just 0.3%. However, zinc and cobalt posted the most significant monthly declines, at 6.8% and 2.1%, respectively.
The EPI measures the relative change in precious and base metals prices, weighted by each metal's overall exploration spending percentage as a proxy for its relative importance to the industry at a given time.
Mining equities rallied
Despite mixed metal price performances, mining equities valuation on aggregate increased. Market Intelligence's aggregate market capitalization of the 2,663 listed mining companies rose 2.4% to $2.13 trillion, from $2.08 trillion in December.
This article was published by S&P Global Market Intelligence and not by S&P Global Ratings, which is a separately managed division of S&P Global.
S&P Global Commodity Insights produces content for distribution on S&P Capital IQ Pro.