S&P Global Offerings
Featured Topics
Featured Products
Events
S&P Global Offerings
Featured Topics
Featured Products
Events
S&P Global Offerings
Featured Topics
Featured Products
Events
Banking & Capital Markets
Economy & Finance
Energy Transition & Sustainability
Technology & Innovation
Podcasts & Newsletters
Banking & Capital Markets
Economy & Finance
Energy Transition & Sustainability
Technology & Innovation
Podcasts & Newsletters
S&P Global Offerings
Featured Topics
Featured Products
Events
Blog — 9 Mar, 2021
Highlights
Global corporate defaults in S&P Global Ratings’ universe of rated corporate issuers in 2020 totaled 226, up by 91% from the previous year's tally of 118.
In Asia Pacific, S&P Global Ratings’ base-case scenario assumes that corporate balance sheets may recover slowly from 2H2021.
Even within countries, there are significant recovery differences expected, depending on the corporate’s industry segment of operation.
Global corporate defaults in S&P Global Ratings’ universe of rated corporate issuers in 2020 totaled 226, up by 91% from the previous year's tally of 118, much of which can be attributed to an increase in defaults in both the U.S. and Europe--which account for the largest number of rated issuers globally and have been heavily affected by the COVID-19 pandemic.[1] However, the 2020 tally was still well below the 2009 total of 266 on the back of supportive governments and central banks, and ensuing market liquidity.
In Asia Pacific, S&P Global Ratings’ base-case scenario assumes that corporate balance sheets may recover slowly from 2H2021 onwards only, albeit at a different pace.[2] Furthermore, this may not be enough to stabilize credit quality yet. Even within countries, there are significant recovery differences expected, depending on the corporate’s industry segment of operation.
Given this backdrop, the need for reliably monitoring credit deterioration in both loan and investment portfolios is becoming increasingly important. This need is further accelerated in a scenario where governments and central banks pull back or selectively provide support, as we saw in some of the recent defaults in Asia Pacific. As such, the business case for an early-warning system is straightforward: it can help lower both credit losses and capital requirements by identifying opportunities to de-risk and improve asset quality in advance of a potential default event. Ideally, it would assist in quickly identifying any ‘red flags’ related to credit deterioration in a borrower or issuer's financial condition.
To help lenders and investors with this key requirement, as well as understand the various factors contributing to a decline in creditworthiness, S&P Global Market Intelligence offers a suite of credit risk data and analytics, including:
The case studies below highlight instances of early warning signals in credit deterioration using S&P Global Market Intelligence’s Credit Analytics offering.
Case Study: Thai Airways International Public Company Limited
Business description
Thai Airways International Public Company Limited (“Thai Airways”) was founded in 1960 and headquartered in Bangkok, Thailand. Together with its subsidiaries, it engages in the operation of airline business through three segments: Air Transportation Activities, Business Units, and Other Activities. As of December 31, 2019, it had a route network servicing 62 destinations in 31 countries with 3 domestic destinations; and a fleet of 103 aircraft. The Ministry of Finance, Thailand is a major shareholder of Thai Airways with around 48% of direct equity ownership in the company as per company filings.
Default event
Thai Airways announced a move towards restructuring via a bankruptcy court after a key government panel in Thailand's Cabinet approved the plan on May 19, 2020. This was the first failure by a national carrier since COVID-19. More than three-quarters of the debt was owed to bond investors at the time. It also has a significant amount of debt maturing in 2020 and the following 1-2 years.
Debt summary and maturity schedule

Key Developments

Source: S&P Capital IQ platform, an offering of S&P Global Market Intelligence. As of September 30, 2020.
However, even before the outbreak, there were several ‘red flags’. Below, we outline some of the key indicators and how to apply our analytical tools as a best practice approach for gauging credit deterioration on an entity’s standalone creditworthiness.
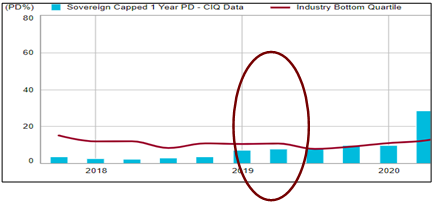
Fundamental PD Model – Thai Airways
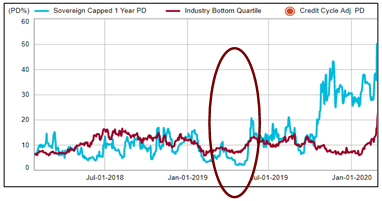
Market Signal PD Model – Thai Airways
Source: Credit Analytics, an offering of S&P Global Market Intelligence. As of March 31, 2020
|
Rolling average Fundamental PD for 2017 – 2018 |
3.63% |
|
Fundamental PD as of June 30, 2019 |
8.45% |
|
Rolling average Market Signal PD for 2017 – 2018 |
6.25% |
|
Market Signal PD as of May 31, 2019 |
16.86% |
|
Fundamental PD as of June 30, 2019 for Thai Airways |
8.45% |
|
Fundamental PD as of June 30, 2019 for Industry Bottom Quartile |
7.70% |
|
Market Signal PD as of May 31, 2019 for Thai Airways |
16.86% |
|
Market Signal PD as of May 31, 2019 for Industry Bottom Quartile |
11.36% |
Our analysis using Market Signal PD model for several hundred public non-financial companies that defaulted between 2003 and 2015 demonstrated that half of the defaulters had a PD above 8%, a full twelve months before default, increasing to 15% at the default date. For a quarter of the companies that “went bust” (the “bottom quartile”), the PD goes from 16% (12 months before default) to more than 28% at the default date. These PD levels may therefore be considered as a trigger level for monitoring early warning signals of credit deterioration.
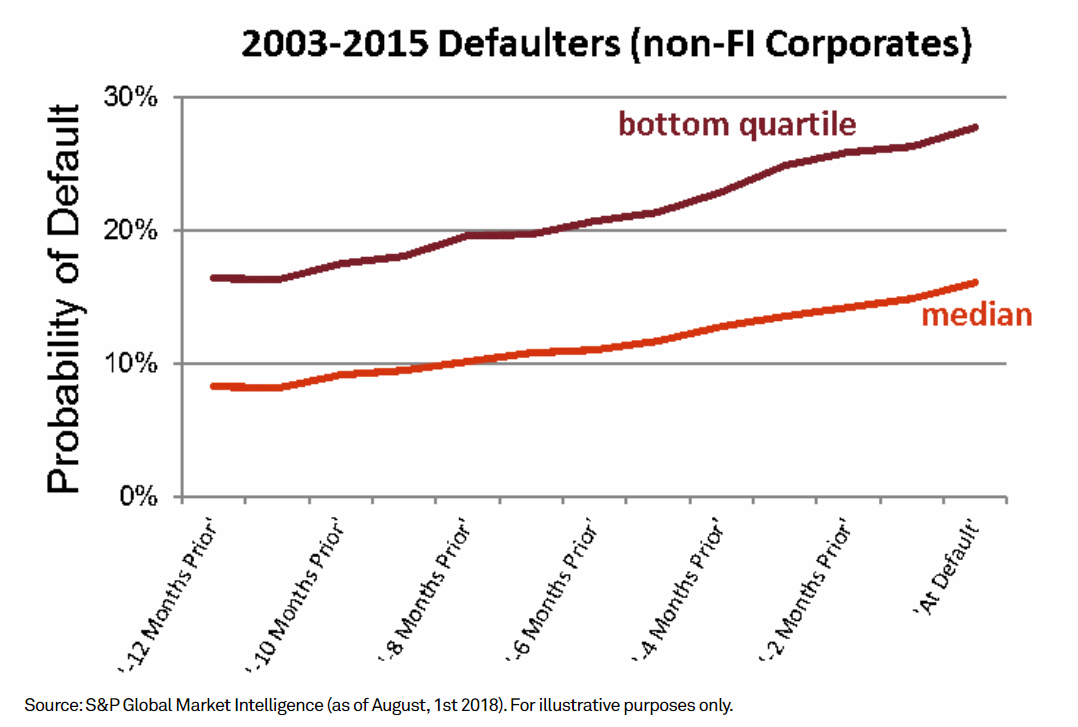
Notably, Thai Airways’s Fundamental PD remains above 8% since June 2019 and Market Signal PD remained in the mid-teens since end of May 2019 which was one year before its default date and for a sustained period thereafter.
Case Study: PT Garuda Indonesia (Persero) Tbk
Business description
PT. Garuda Indonesia (Persero) Tbk (“Garuda Indonesia”) provides airline services in Indonesia and internationally. It operates through Flight Operation, Aircraft Maintenance Services, and Other Operations segments. The company undertakes the scheduled and non-scheduled commercial air transportation of domestic or international passengers, cargoes, and mails; and provides aircraft repair, maintenance, and overhaul services. It also distributes computerized reservation systems; and provides travel agency, ticketing, aircraft rental, catering, hotel management, cargo, information technology, and ground handling services. The company operates through a fleet of 142 aircraft. Garuda Indonesia (Persero) was founded in 1949 and is headquartered in Jakarta, Indonesia.
Default event
Garuda Indonesia was in talks with several banks about refinancing in March 2020 and was hoping to avoid default on its $500 million notes due June 3, 2020 despite challenges presented by the coronavirus. Like airlines around the world, the Indonesian flag carrier has been deeply damaged by the virus and its impact on travel. In June 2020, it narrowly avoided the default by agreeing with its bondholders to extend the maturity of the debt. This was not the first time the company sought leniency from its creditors. In 2017 as well, Garuda Indonesia wanted to amend conditions and definitions related to its consolidated debt. Then in 2018, the company revised its financial results for 2017 from a net profit to a recorded net loss of US$175 million.
Debt summary and maturity schedule

Key “Red-Flagged” News

Source: S&P Capital IQ platform, an offering of S&P Global Market Intelligence. As of September 30, 2020
Accordingly, below we outline some of the key indicators and how to apply our analytical tools as a best practice approach for gauging credit deterioration.
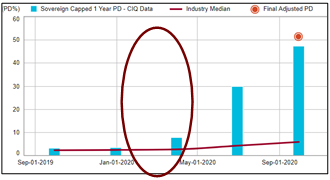
Fundamental PD Model – Garuda Indonesia
Market Signal PD Model – Garuda Indonesia
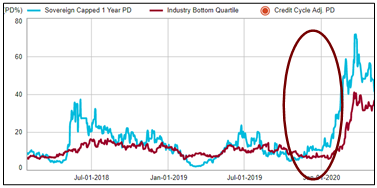
Source: Credit Analytics, an offering of S&P Global Market Intelligence. As of March 31, 2020
|
Rolling average Fundamental PD for 2018-2019 |
5.23% |
|
Fundamental PD as of March 31, 2020 |
7.71% |
|
Rolling average Market Signal PD for 2018-2019 |
8.95% |
|
Market Signal PD as of February 28, 2020 |
58.64% |
|
Fundamental PD as of March 31, 2020 for Garuda Indonesia |
7.71% |
|
Fundamental PD as of March 31, 2020 for Industry Median |
2.52% |
|
Market Signal PD as of February 28 2020 for Garuda Indonesia |
58.64% |
|
Market Signal PD as of February 28, 2020 for Industry Bottom Quartile |
22.41% |
Our analysis using Market Signal PD model for several hundred public non-financial companies that defaulted between 2003 and 2015 demonstrated that half of the defaulters had a PD above 8%, a full twelve months before default, increasing to 15% at the default date. For a quarter of the companies that “went bust” (the “bottom quartile”), the PD goes from 16% (12 months before default) to more than 28% at the default date. These PD levels may therefore be considered as a trigger level for monitoring early warning signals of credit deterioration

Notably, Garuda Indonesia’s Market Signal PD remained in the mid-teens since June 2019 for a sustained period, which was one year before its default date.
[1] Source: S&P Global Ratings - Default, Transition, and Recovery: The 2020 Global Corporate Default Tally Reached 226; dated Jan 08, 2021
[2] Source: S&P Global Ratings - Asia-Pacific Corporate and Infrastructure Credit Outlook 2021; dated Jan 20, 2021
[3] S&P Global Ratings does not contribute to or participate in the creation of credit scores generated by S&P Global Market Intelligence. Lowercase nomenclature is used to differentiate S&P Global Market Intelligence PD credit model scores from the credit ratings issued by S&P Global Ratings.
Solution
Blog
Blog
Products & Offerings

