S&P Global Offerings
Featured Topics
Featured Products
Events
S&P Global Offerings
Featured Topics
Featured Products
Events
S&P Global Offerings
Featured Topics
Featured Products
Events
Banking & Capital Markets
Economy & Finance
Energy Transition & Sustainability
Technology & Innovation
Podcasts & Newsletters
Banking & Capital Markets
Economy & Finance
Energy Transition & Sustainability
Technology & Innovation
Podcasts & Newsletters
S&P Global Offerings
Featured Topics
Featured Products
Events
Research — 23 Aug, 2023

By Shunyu Yao
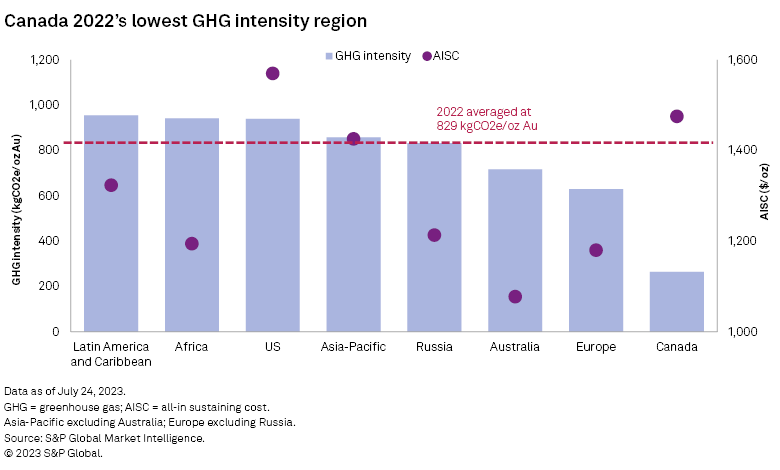
An S&P Global study of 146 primary gold mines globally shows greenhouse gas emission intensity averaged 829 kilograms of CO2 equivalent per ounce of gold in 2022, based on sustainability reporting by related companies. The 146 mines produced 31.1 million ounces of gold in 2022, representing 54.2% of the Mine Economics primary gold mine coverage, or about 36% of global gold mine production. Geographically, assets in Canada had the lowest emission intensity, averaging about 265 kgCO2e/oz. All mines in Canada within the sample are linked to grid power systems, which is beneficial to emission reduction.

– A study of 146 primary gold mines reported an average greenhouse gas emission intensity of 829 kilograms of CO2 equivalent per ounce of gold produced in 2022. Canadian mines reported the lowest intensity, as the country's main gold mining regions are mostly serviced by renewable electricity sources.
– The scale of operation affects GHG emissions, with large-scale gold mines tending to have a lower intensity.
– The global GHG intensity remained unchanged between 2020 and 2022. Canada led in emission reduction, but this was offset by increases in Africa and Latin America. A faster effective transition to renewable electricity generation sources will help gold miners achieve emission targets.

Two-thirds of Canada's electricity is powered by renewable sources, of which 83% is from non-GHG-emitting sources, as per data from Natural Resources Canada. While nine out of 10 US mines in this study use grid power as their primary electricity supply, 79% of electricity in the US is generated from burning fossil fuels. Gold mines in the US averaged about 939 kgCO2e/oz in 2022.
In other regions, the number of mining assets using GHG-emitting sources — including diesel, heavy fuel oil, coal and gas — is greater than in Canada. In this study, Latin America, the Caribbean and Africa topped GHG intensity, accounting for 52% of production covered in the study. Meanwhile, our cost data shows no apparent correlation between GHG intensities and production costs; lower emissions did not help Canada become a low-cost gold-producing region.
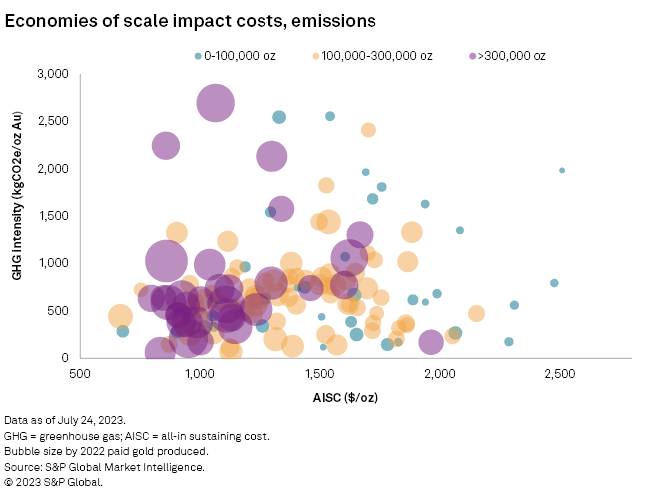
Instead, we found that economies of scale affect emissions. We split the 146 mines into three groups based on paid metal production. In the below bubble chart, assets with less than 100,000 ounces of output tend to plot in the high-intensity, high-cost area, while most assets with an output greater than 300,000 ounces are concentrated in the low-intensity, low-cost area. The low production group averaged 937 kgCO2e/oz, with a $1,551/oz all-in-sustaining cost (AISC) in 2022. The high production group averaged 798 kgCO2e/oz, with an AISC of $1,105/oz. The intermediate group averaged 849 kgCO2e/oz, with a $1,376/oz AISC. This indicates that economies of scale impact not only production costs but also emission management. The impacts are less correlated with geography, as only one asset in the high-production group comes from Canada, while the other assets are widely distributed geographically.
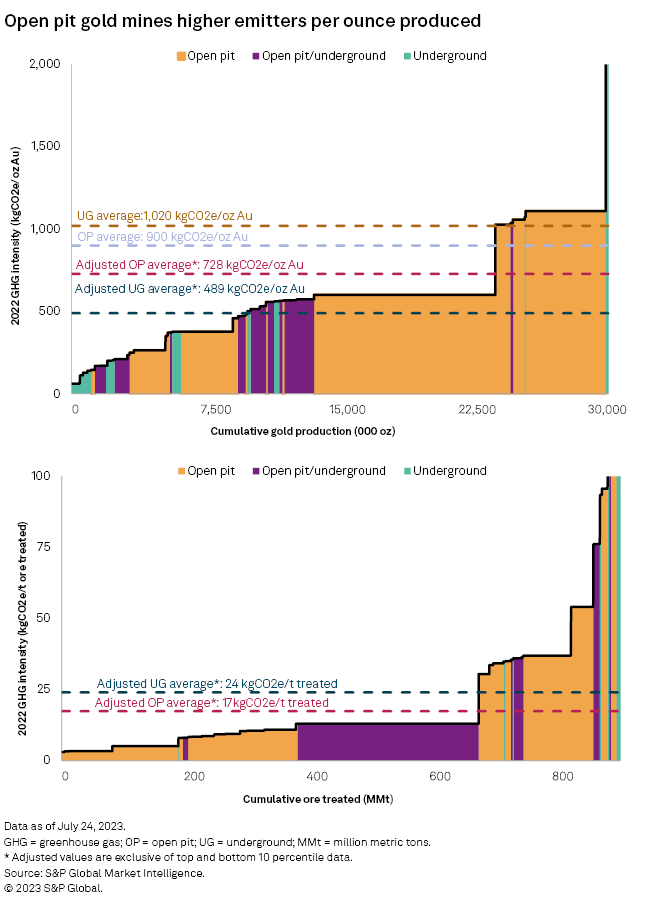
Data also suggests that underground mines generally have lower GHG footprints. Although underground mines emit 15% more GHG than open pit mines based on weighted average emissions, further research shows that high emissions are dragged down by extreme values. After stripping out below the 10th and above the 90th percentiles of emissions, the adjusted result shows underground mines averaged 489kgCO2e/oz — nearly one-third less than open pits. On the emissions curve, we can see most open pit mines in the upper half.
Regarding emissions on an ore tonnage basis, after the above adjustments, open pit mines emit 17 kgCO2e per metric ton of ore treated, which is 7 kgCO2e less than underground mines; however, underground operations tend to have higher grades and recovery. The 2022 data shows the weighted average treated ore grade for underground mines was 4.54 grams of gold per metric ton with 92% recovery, in comparison to 71 open pit mines with 0.88 g/t Au and 76% recovery. While head grades and recoveries are not the only factors in emissions management, these figures support the assumption that production efficiency can help reduce emissions on the basis of ounces of gold produced.
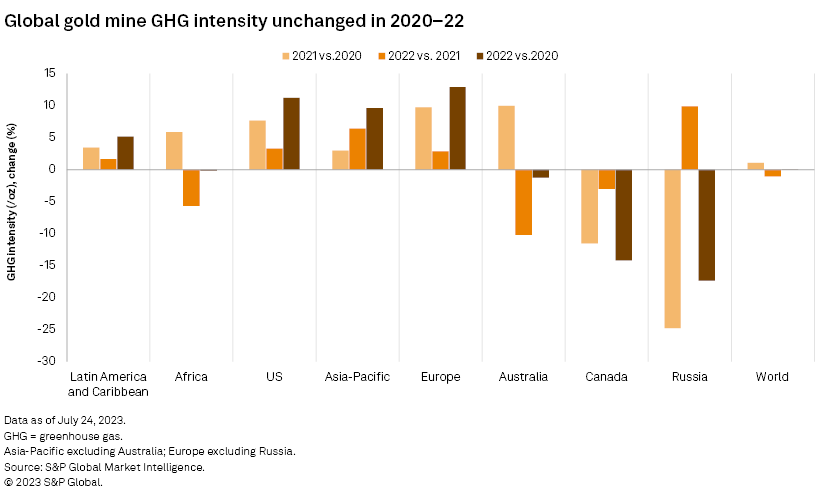
In this study, we also made a comparison group using 101 mines that published three years of consecutive emission data between 2020 and 2022. Data from the comparison group shows the GHG intensity of global primary gold mines was up 1% year over year in 2021, was down 1% in 2022 and remained unchanged overall between 2020 and 2022 on a per-ounce basis.
Canada led in cutting emissions, reducing intensity by 12% year over year in 2021 and a further 3% in 2022. In Canada, the GHG intensity of the Seabee operation was significantly reduced from 509 kgCO2e/oz in 2020 to 146 kgCO2e/oz in 2022. Based on SSR Mining Inc.'s reports, renewable energy consumption at Seabee was 8% of overall consumption in 2020, increasing to 67% in 2021 and helping the mine reduce nearly 80% of its Scope 2 emissions in the past two years. Emission intensity in the US and Asia-Pacific regions has increased for two consecutive years, which may be associated with falling ore grades and recoveries. In the reporting period, gold head grade in the US was down to 0.41 g/t from 0.48 g/t, and recovery was down to 65% from 73% in the studied mines. Gold head grade in Asia-Pacific was down to 1.40 g/t from 1.63 g/t, and recovery was slightly down to 80% from 82%.
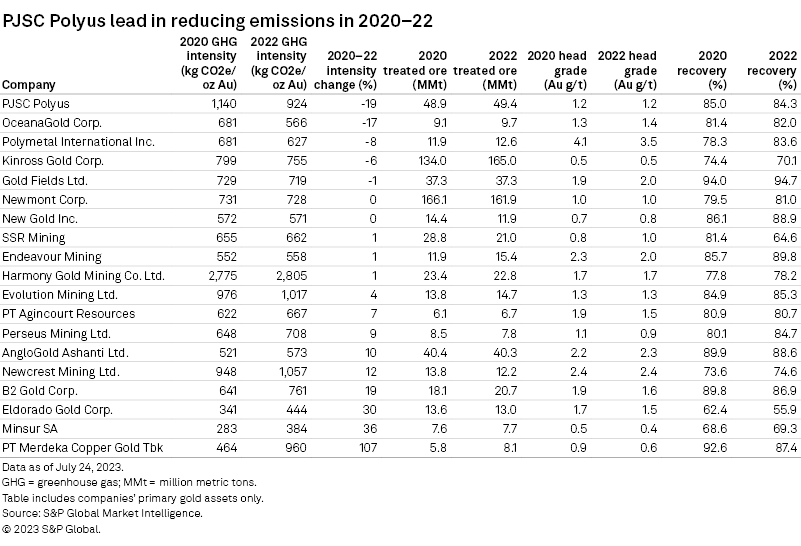
Within the comparison group, we further picked companies that processed more than 5 million metric tons of ore in 2022. PJSC Polyus led in reducing emissions, with its 2021 company report stating that renewable energy can cover 100% of its electricity demand. But Polyus' performance did not show consistency. For example, the GHG intensity of the Blagodatnoye and Natalka mines fell in 2021 and rose again in 2022. This may have been the result of reducing ore grades and increasing mined waste materials. The GHG intensity of OceanaGold Corp. was down 17% in 2022 from 2020 levels after purchasing New Zealand Renewable Energy Credits. Harmony Gold Mining Co. Ltd. reported the highest GHG intensity, with most of its assets in South Africa and coal meeting about 77% of the region's energy needs.
Currently, the most effective path for companies to achieve their emission target is to replace nonrenewable with non-GHG-emitting renewable as primary energy sources. Emission reductions seem passive for many grid-system-connected mining assets, as they rely more on governments or suppliers to have the ability to enhance renewable penetrations. Still, they can also choose to invest in renewable alternatives, such as in South Africa, where Gold Fields Ltd. completed the South Deep Khanyisa solar plant in August 2022 and Harmony Gold's 30-MW solar project is in progress. Improving production efficiency does not guarantee that gold miners will reduce GHG intensity, because ore grades and recoveries may change in the future. Looking forward, we will continue to follow producers' investments and uses of clean energy.
This article was published by S&P Global Market Intelligence and not by S&P Global Ratings, which is a separately managed division of S&P Global.
