S&P Global Offerings
Featured Topics
Featured Products
Events
S&P Global Offerings
Featured Topics
Featured Products
Events
S&P Global Offerings
Featured Topics
Featured Products
Events
Banking & Capital Markets
Economy & Finance
Energy Transition & Sustainability
Technology & Innovation
Podcasts & Newsletters
Banking & Capital Markets
Economy & Finance
Energy Transition & Sustainability
Technology & Innovation
Podcasts & Newsletters
S&P Global Offerings
Featured Topics
Featured Products
Events
Research — 31 Aug, 2023

By Adam Wilson
Wind turbines across the US are getting bigger and taller and generating more power. US turbine installation trends show average rated capacity increasing from less than 2 MW in 2014 to over 3.8 MW in 2023. Average rotor diameters have increased nearly 40% over the same period, with hub heights approaching 100 meters. The fact that costs have risen due to the combination of inflation and logistical and supply chain challenges has rendered optimizing the production of every turbine manufactured more crucial than ever.

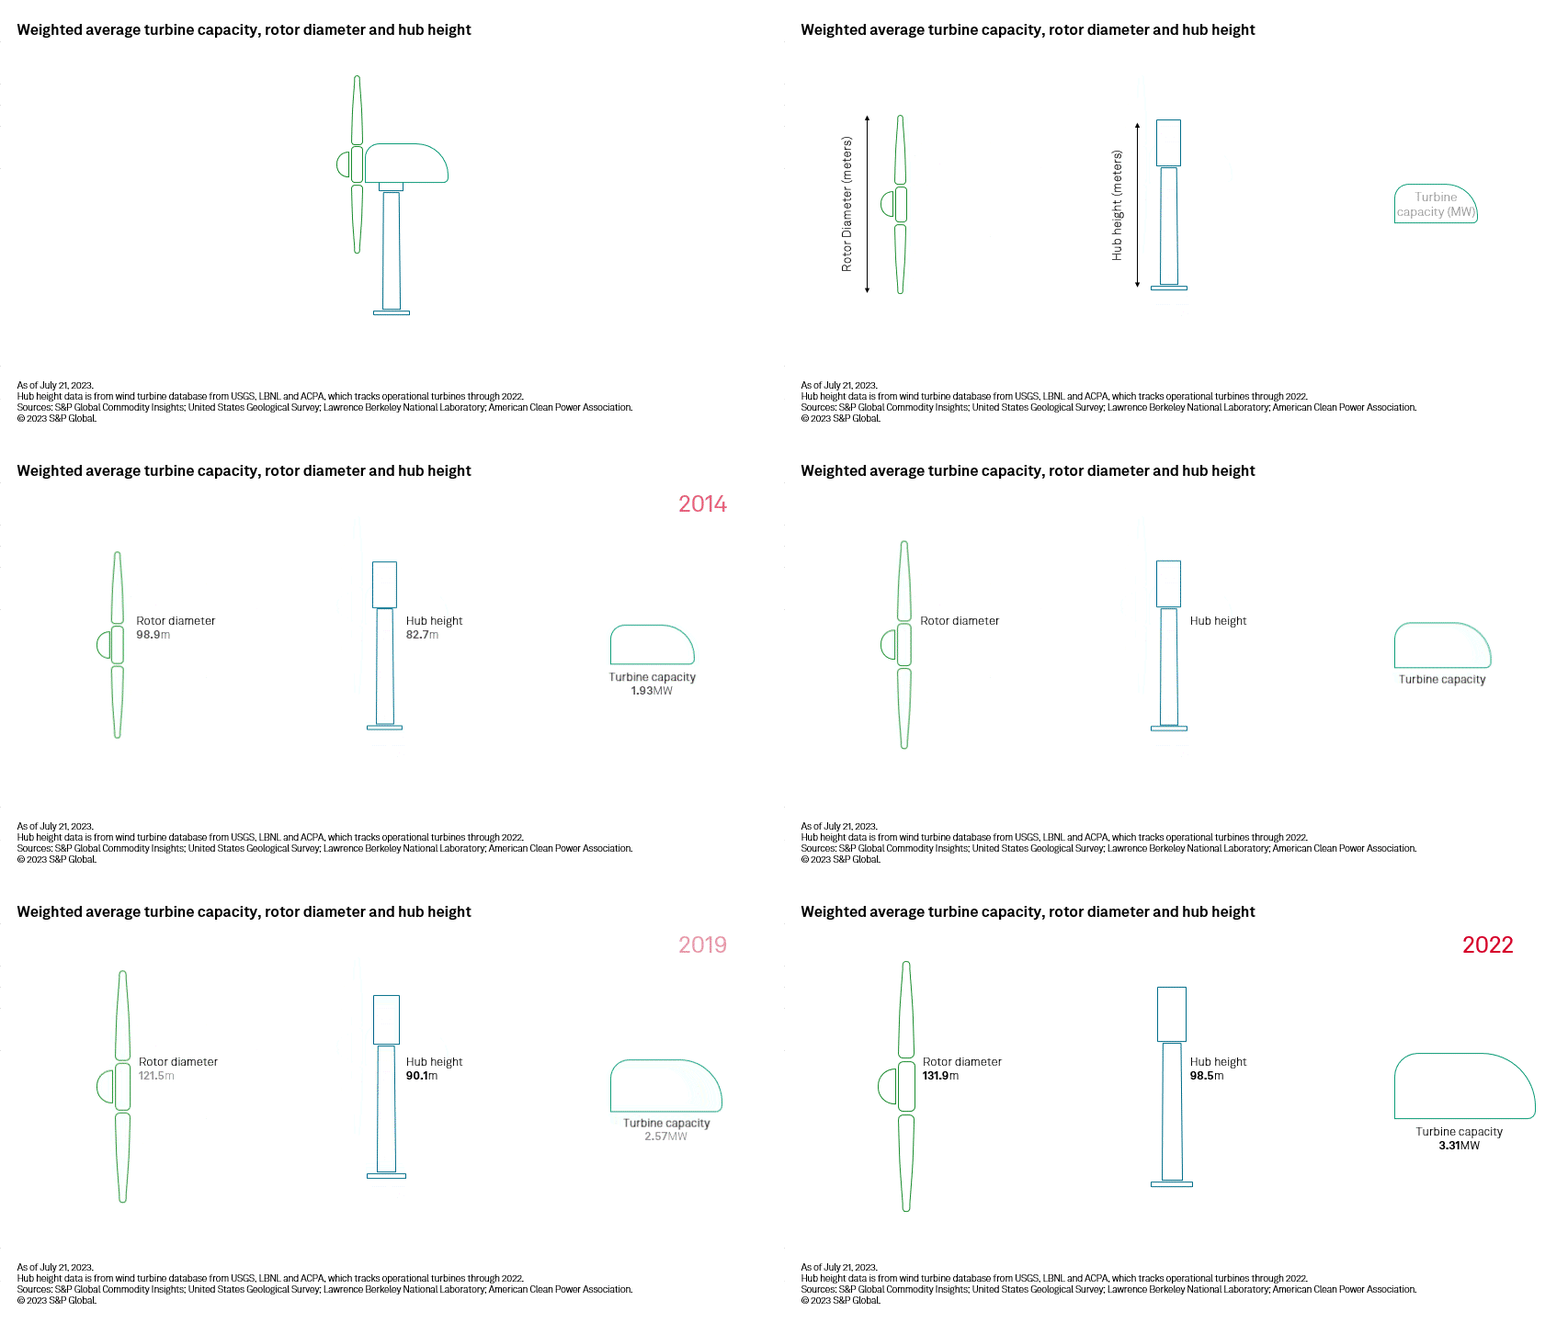
Wind turbines installed across the US have doubled in average rated output from 2014 to 2023, with machines currently being installed averaging nearly 3.9 MW. The average turbine now has a 40% larger rotor diameter of 137 meters and a hub height approaching 100 meters.
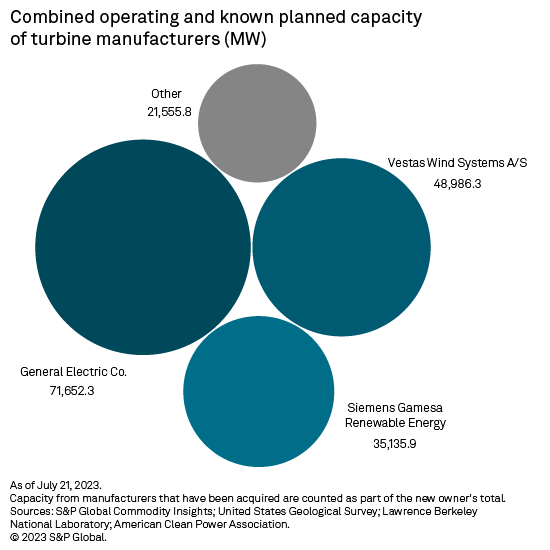
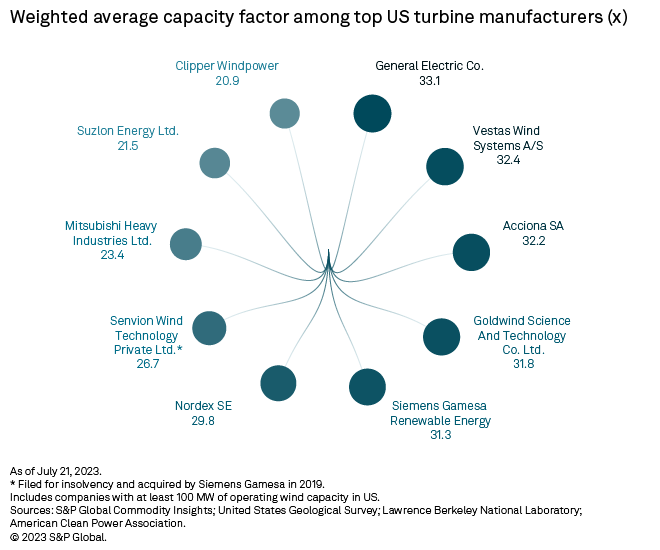
General Electric Co. (GE) leads all manufacturers in installed wind turbine capacity in the US, with its combined operating and known upcoming orders surpassing 71 GW. The company also ranks first in average turbine performance, with a portfoliowide capacity factor of 33.1%. Vestas Wind Systems A/S ranks second in both installed capacity and average capacity factor.
Rising turbine costs caused by inflation and supply chain complications have caused turbine orders to slump over the past 18 months. While domestic policy drivers, notably the Inflation Reduction Act, are expected to prompt a turnaround, the necessity of having optimal-performing turbines is higher than ever.

Bigger, taller, more diverse
Average wind turbine specifications remain on an upward trajectory, with towers getting taller, blades longer and power output higher. As the wind industry matures, so do technology and infrastructure, allowing the ability to construct, transport and install increasingly large machines. Turbines installed in 2010 or before averaged an output of 1.44 MW. By 2021, this average had more than doubled to over 3 MW per turbine. Machines installed or expected to be installed in 2023 average a rated capacity of 3.87 MW.

Rotor diameters have followed a similar trend, as turbines installed in or before 2010 averaged about 72 meters. This has steadily increased, from 100 meters in 2015 to 137 meters in 2023. A turbine with a rotor diameter of 137 meters would require a blade over 200 feet long.
Hub heights are also increasing, with machines installed in 2022 averaging a height of 98.5 meters — a rise of over 25 meters compared with turbines installed in 2010 or earlier. According to research from the National Renewable Energy Laboratory, turbines with hub heights of 110 meters experience up to 1.0 m/s higher wind speeds than those with hub heights of 80 meters. Additionally, higher turbines face less disturbance from surface-level features, such as topographic changes, vegetation and man-made structures.
Manufacturers are not just making turbines bigger and taller, however. They are also expanding their product lines, offering machines with multiple options of rotor diameters across a single rated capacity and giving developers the ability to select a turbine best suited for a given location, or vice versa. For example, Vestas has at least five different rotor diameters available in its 2.0-MW turbines. GE's 1.6-MW turbines offer upward of seven different rotor diameter options.
Specific power best captures this variability in turbine capacity and rotor diameter, but through dividing the rated capacity in watts by the turbine's swept area in square meters. Turbines with a higher specific power are typically better suited for areas with strong wind resources. Machines with lower specific power leverage larger blades to optimize generation in regions with subpar average wind speeds.
Average specific power in 2010 and before was 347 watts per square meter. By 2020, the average turbine had a specific power of 220 W/m2, indicating that rotor diameter growth had outpaced capacity growth across wind units in the US. This also highlights the wind industry's expansion outside the windy central US corridor from Texas and Oklahoma into states such as Iowa and Minnesota.
Since 2020, however, average specific power has begun to nudge upward again, with 2023 turbines averaging 254 W/m2.
Forward-looking trends in turbine statistics are limited to projects that have announced specific turbines, but the upward trend of capacities and rotor diameters, in general, is expected to continue. The growth of the offshore wind industry, in particular, will drive up these figures, with offshore turbines now boasting rated capacities of 15 MW and rotor diameters well in excess of 200 meters. Though manufacturers continue to push the envelope in turbine size, there are signs they might approach a ceiling , as blade sizes are beginning to outpace what is logistically feasible to transport and install.
The big three continue to dominate
 |
Roughly two dozen manufacturers have operating wind turbines in the US, according to Commodity Insights analysis. Nearly 90% of installed capacity, however, comes from just three companies — GE, Vestas and Siemens Energy AG majority-owned Siemens Gamesa Renewable Energy SA . This trio of wind turbine manufacturing giants have emerged as clear market leaders in the US. German manufacturer Nordex SE is fourth with 5,500 MW installed, far behind third-placed, Spanish-headquartered Siemens Gamesa, which has over 35 GW operating in the US.
US-based engineering conglomerate GE leads in operating capacity, with over 71 GW in operation and planning. GE's 1.5-MW turbine is currently the most popular in the market, with over 7,000 units in operation. The company's 2.8-MW, 127-meter rotor diameter turbine is also commonly utilized, with just over 4,500 turbines installed.
Vestas currently ranks second, with nearly 49 GW of installed wind capacity in the US. The company's V110-2.0 platform is its most-often selected option in the country, with over 3,300 turbines in operation, though Vestas has a diverse fleet of machines in use. Siemens Gamesa's SWT-2.3 series is also popular, with nearly 3,700 units currently in operation or planning.
Not only does GE lead in installed capacity in the US, it also tops the leaderboard in portfolio performance. The company's operating wind power base averages a 33.1% capacity factor, according to Commodity Insights analysis. Vestas is a close second at 32.4%. Siemens Gamesa, in this category, ranks fifth with 31.3%, preceded by Spanish-based Acciona SA and Chinese manufacturer Goldwind Science and Technology Co. Ltd. taking the third and fourth spots, respectively.

Headwinds remain
While the passing of the Inflation Reduction Act has prompted a surge in renewable development in the US, turbine manufacturers have observed slumping orders because of rising costs driven by inflation and the ongoing difficulties in supply chain and transportation logistics. All three major US wind turbine suppliers took on losses in 2022 .
Exacerbating these economic pressures are the recently reported quality issues from major turbine manufacturers, notably Siemens Gamesa. Component failures across the company's global wind fleet resulted in €2.2 billion in charges from operational and technical issues, causing its stock price to nosedive. Vestas' stock price also took a hit, leading some to claim the quality issues to be industrywide.
GE reported losses of $2.24 billion in 2022 in its renewable energy segment due to inflation and, at the time, policy uncertainty. Additionally, fallout from a patent lawsuit with Siemens Gamesa will impact GE's offshore wind revenues, as the latter is expected to pay royalties for turbines used at the Vineyard Offshore Wind Project and Ocean Offshore Wind Farm . GE is expecting a turnaround in 2024 , however, as extended tax credits from the Inflation Reduction Act are expected to bear fruit .
These hurdles are further pressurizing these manufacturers to continue producing better-performing machines. Trends reflect this push as annual capacity factors for new machines continue to improve. Annual capacity factors around the US now consistently hover above the 40% mark. Larger rotor diameters, higher hub heights and other improved components are leading to greater output. Should the industry ride out the currently volatile economic climate, these machine upgrades should pay dividends.
For wholesale prices and supply and demand projections, see the S&P Global Market Intelligence Power Forecast .
Regulatory Research Associates is a group within S&P Global Commodity Insights.
S&P Global Commodity Insights produces content for distribution on S&P Capital IQ Pro.
This article was published by S&P Global Market Intelligence and not by S&P Global Ratings, which is a separately managed division of S&P Global.
