


Research — 13 Jul, 2023
For US Gen Z adults and millennials, social media is a way of life

By Keith Nissen
How social media is used is generational, with young American social media users relying on their apps for news, entertainment discovery and content as well as everyday product and service information, according to a recent Kagan US Consumer Insights survey. For many Gen Z adults and millennials, social media has become woven into the fabric of their lives.

➤ Data from the Kagan first-quarter 2023 US Consumer Insights survey shows the majority of Gen Z and millennials, along with half of Gen Xers, tend to use social media for many activities beyond messaging, whereas baby boomers and seniors do not.
➤ Gen Z adults and millennials are much more likely than older generations to rely on social media for their news, sports highlights, short-form videos, TV/video content discovery and product/service information.
➤ Regardless of generation or age, US social media users are evenly divided over their willingness to avoid certain social media platforms because of perceived political bias or misinformation labeling practices.
➤ Americans strongly prefer free social media apps with ads over paid ad-free access. They also are less enthusiastic about using social media platforms for activities such as e-commerce and digital payments.

To better understand how social media impacts the lives of Americans, we asked respondents to the Kagan first-quarter 2023 US Consumer Insights survey if they agreed or disagreed with a set of social media-related preference statements. Previously published Kagan reports found that, on average, social media-using Americans use 3.2 apps but that young Gen Z adults (18-25 years old) and millennials (26-42 years old) who are more likely to use services such as TikTok, Telegram or Discord are often active on five or more social media platforms. In addition, the survey data confirmed that 75% of those who spend five or more hours on social media were young Gen Z adults and millennials, whereas 81% of those spending less than one hour per day were older Gen Xers (43-57 years old), baby boomers and seniors (ages 58 and above).
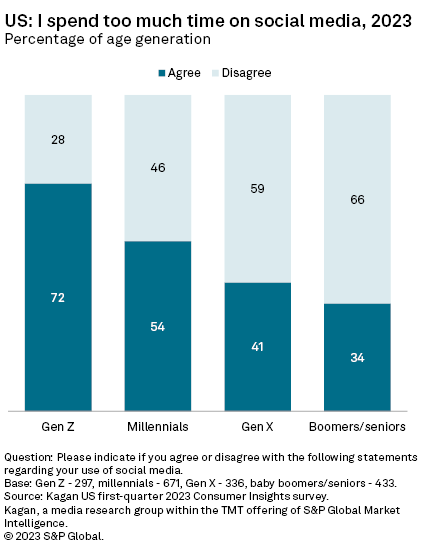
This correlation between age generation and social media use is also reflected in much of the social media preference data presented in this report. For example, we asked respondents if they agreed or disagreed to the statement "I spend too much time on social media." Overall, 58% of surveyed social media users agreed. However, 72% of Gen Z adults thought that they spend too much time on social media, compared to only 34% of baby boomers and seniors. The main takeaway is that those who tend to spend the most time on social media (Gen Z adults and millennials) acknowledge they spend too much time using the apps but do it anyway.
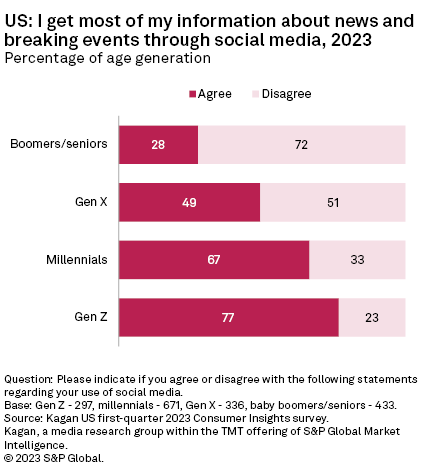
Part of the reason younger adults find it hard to limit social media use is because social media has become woven into the fabric of their lives. Prior to the advent of social media, Americans received news from a variety of traditional sources, such as broadcast TV and cable news programs, along with newspapers, magazines and radio. The survey found that today, the majority (55%) of social media users in the US get most of their news through social media. Over three-quarters (77%) of Gen Z adults and two-thirds (67%) of millennials rely on social media for news of current events. In contrast, only 28% of baby boomers and seniors report getting most of their news from social media.
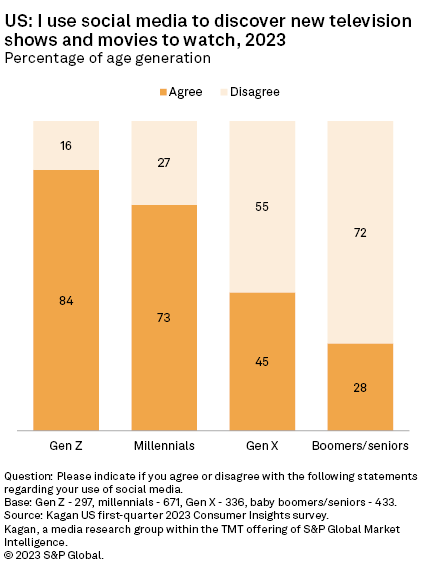
In addition to news, the majority (58%) of those Americans using social media log in to decide what TV shows and movies to watch. The survey data reveals that the vast majority of Gen Z adults (84%) and millennials (73%) rely on social media for TV/video entertainment discovery. Even though the majority of baby boomers and seniors are active on social media, most do not use social media for content discovery, preferring to use more traditional sources, such as advertisements, TV schedule guides and online video library searches/recommendations.
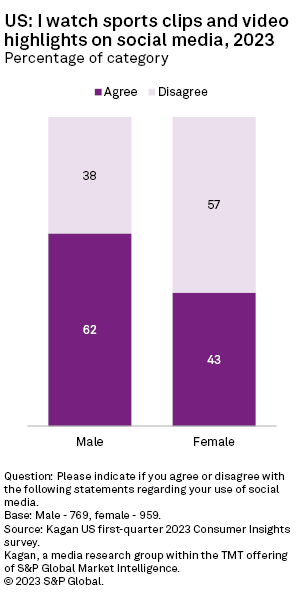
Another popular social media activity for a slight majority (51%) of US social media users is watching sports clips and related video highlights. Watching sports clips is skewed toward men at 62%, compared to 43% of women. The majority of Gen Z adults (58%), millennials (59%) and Gen Xers (53%) said they watch sports clips on social media. Only 35% of baby boomers and seniors use social media for viewing sports highlights.
The survey found that Americans on social media tend to use it less for product information than for watching video. Only 37% of respondents who use social media agreed with the statement "I often purchase products after seeing an ad or post about the product on social media." Responses from men and women were essentially alike. However, once again the data highlights a generational divide where approximately half of Gen Z adults (49%) and millennials (48%) indicated that ads and posts on social media often influence their product purchases compared to 26% of Gen Xers and 20% of baby boomers and seniors.

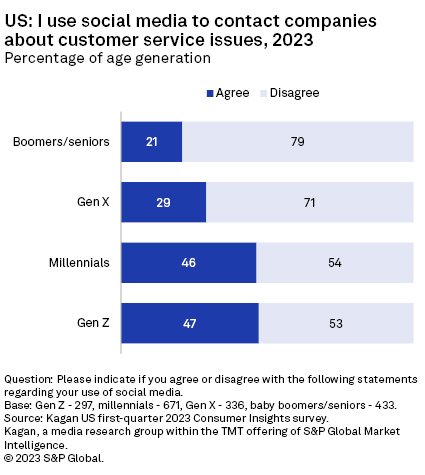
At a nearly identical rate of response, 37% of surveyed social media users agreed with the statement "I use social media to contact companies about customer service issues." The data indicates that men (41%) are more likely to use social media for customer service issues than women (33%). But nearly half of Gen Z adults (47%) and millennials (46%) said they use social media for customer service issues, compared to 29% of Gen Xers and 21% of baby boomers and seniors.
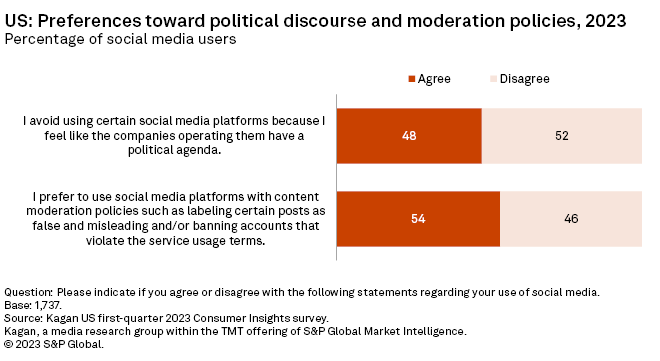
Activities performed on social media can also impact the choice of social media apps used. For instance, survey respondents were divided nearly evenly when responding with "true" or "false" to the statement "I avoid using certain social media platforms because I feel like the companies operating them have a political agenda." Respondents were also split down the middle regarding their preferences for using social media platforms that employ content moderation practices, such as labeling false or misleading posts. Whether one agrees or disagrees with these preference statements is not affected by age, gender or how much time is spent on social media. Rather, the survey responses may be driven by what type of content is being accessed (such as political discourse) and the amount of trust placed in various news sources.
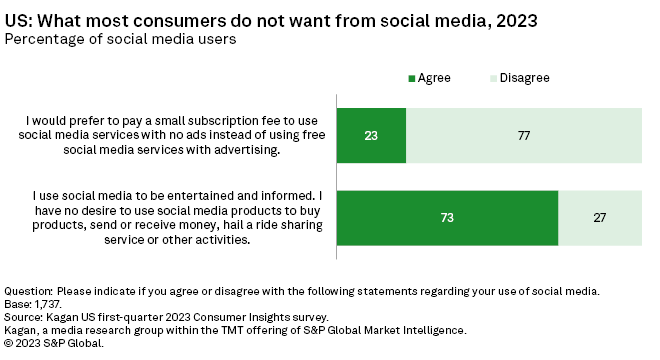
Finally, the survey highlighted some things that most social media users do not want from their apps. When we asked if consumers would prefer to pay a subscription fee in exchange for an advertisement-free social media experience, the answer was a resounding no. Over three-quarters (77%) indicated they prefer that social media remain free, even if they have to view advertisements.
Approximately three-quarters (73%) of social media users also said they have no interest in using a social media platform for buying products, digital payments or other e-commerce related activities. This is in line with other survey results that showed only 22% of survey respondents used a social media platform to purchase items and 16% used Facebook Messenger to send or receive money over the past year.
Data presented in this article was collected from the Kagan US first-quarter 2023 Consumer Insights survey conducted during March 2023. The US Consumer Insights surveys consisted of approximately 2,500 internet adults per wave, with a margin of error of +/- 1.9 ppts at the 95% confidence level. Percentages are rounded to the nearest whole number.
To submit direct feedback/suggestions on the questions presented here, please use the "feedback" button located above, directly under the title of this article. Note that while all submissions will be reviewed and every attempt will be made to provide pertinent data, Kagan is unable to guarantee inclusion of specific questions in future surveys.
For more information about the terms of access to the raw data underlying this survey, please contact support.mi@spglobal.com.
Consumer Insights is a regular feature from Kagan, a part of S&P Global Market Intelligence.
This article was published by S&P Global Market Intelligence and not by S&P Global Ratings, which is a separately managed division of S&P Global.