Featured Topics
Featured Products
Events
S&P Global Offerings
Featured Topics
Featured Products
Events
S&P Global Offerings
Featured Topics
Featured Products
Events
S&P Global Offerings
Featured Topics
Featured Products
Events
Financial and Market intelligence
Fundamental & Alternative Datasets
Government & Defense
Professional Services
Banking & Capital Markets
Economy & Finance
Energy Transition & Sustainability
Technology & Innovation
Podcasts & Newsletters
Financial and Market intelligence
Fundamental & Alternative Datasets
Government & Defense
Professional Services
Banking & Capital Markets
Economy & Finance
Energy Transition & Sustainability
Technology & Innovation
Podcasts & Newsletters
Research — 9 Jul, 2021
Summary
S&P Global Ratings’ Corporate issuer credit ratings (ICRs)[1] are subject to change at any point in time, based on, among other considerations, changes in the business risk profile or financial risk profile of the issuer, or the prospects of the industry in which the issuer operates. As the lowest Investment Grade (IG) rating, BBB- defines the threshold from Investment Grade (IG) to Speculative Grade (SG). Any downgrade/upgrade from or to IG has significant impact for bondholders and other stakeholders, for example on the calculation of the expected credit loss of an insurer’s investment portfolio under International Financial Reporting Standard (IFRS) or Current Expected Credit Loss (CECL) standards or for high-yield investors. Thus, anticipating the next potential rating movement or its direction can be very useful for a variety of purposes, including portfolio construction, rebalancing, risk management and reporting purposes. Recently, additional and granular component factors underlying S&P Global Ratings’ ICRs have been made available via S&P Global Market Intelligence’s RatingsXpress® product.
Our analysis and the findings below are based on S&P Global Ratings rated credits and S&P Global Ratings corporate credit rating methodology. As shown in Figure 1 below, two major underlying factors of a S&P Global Ratings Corporate credit rating include Business Risk (BR) and Financial Risk (FR). An entity’s business risk profile is determined based on the combined assessment of industry risk, country risk, and competitive position of the issuer relative to its peers. The financial risk profile assessment is based on financial ratios covering cash flow/leverage analysis. These two factors are combined into an “anchor” score that can be notched up or down by a set of modifier factors, including liquidity, financial policy, diversification, comparable rating analysis and quality of management considerations. The modified anchor is usually referred to as the Stand-Alone Credit Profile (SACP). The final issuer credit ratings considers the potential effect of Group and Government support considerations on the SACP.
Figure 1: Corporate rating criteria framework

Source: Corporate Ratings Methodology, S&P Global Ratings, 2014. For illustrative purposes only.
Our findings indicate that for similarly rated credits in the high SG and low IG category, the underlying business risk score may help discern the credit strength of corporate issuers.
In this case study we show how business risk and financial risk scores can help with gauging future changes to a Corporate ICR over a certain time horizon, which may help credit risk and investment managers better monitor and manage their portfolios.
Our Findings
The data used in the analysis is available via RatingsXpress. The sample period ranges from January 2014 to December 2020 and includes more than 5000 unique rated companies.
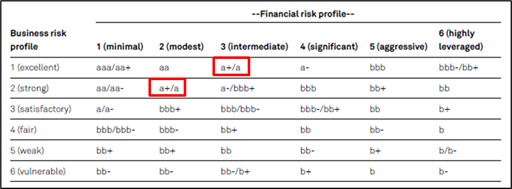
Figure 2 shows the S&P Global Ratings criteria delineating the anchor scores corresponding to various combinations of BR and FR values. The range 1 to 6 indicates best to worst risk categories respectively. We will keep referring to Figure 2 and identify the (BR, FR) combination that defines the specific anchor group. For example, (1,3) and (2,2) form the ‘a+/a’ anchor category.[2]
Figure 2: Business risk and financial risk categories

Source: Corporate Credit Rating Methodology, S&P Global Ratings. As of January 5, 2021. For illustrative purposes only.
In this analysis, we study the impact of several combinations of business risk and financial risk scores, on the next rating movement[3] over a defined time horizon. For example, we use business risk and financial risk scores of 2014 and observe the corresponding rating movement of issuer credit ratings in 2015 and in 2017, for a 1-year and 3-year time-horizon, respectively.
Overall rating behaviour
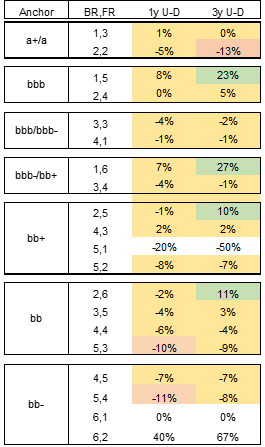
We first analyze the overall impact of the BR and FR components independent of the initial rating, across all years included in our dataset[4]. For this purpose, we combine all rating categories and calculate the historical observed frequency of an ICR downgrade or an upgrade, over a 1-year and 3-years’ time-horizon, for various (BR, FR) combinations. Table 1 reports the frequency difference between upgrades and downgrades, related to the same anchor.[5] For example, looking at the top two rows of the table, companies with ‘a+/a’ anchor score have 1% more ICR upgrades than downgrades for the (1,3) combination and, conversely, 5% more ICR downgrades than upgrades, for the (2,2) combination, over a 1-year time horizon. We highlight in green (red) cases where the difference between upgrade and downgrade frequency is higher (lower) than or equal to 10% (-10%) and we set in yellow all intermediate cases. Not highlighted cells have too few observations for any meaningful inference.[6]
Table 1: ICR upgrade (U) minus downgrade (D) frequency for anchor scores resulting from different combinations of business risk and financial risk scores.

Source: RatingsXpress, S&P Global Market Intelligence. As of January 5, 2021. For illustrative purposes only.
In general, for most anchor scores considered, lower values of underlying business risk result in stronger credit performance as measured by upgrades minus downgrades of the respective cohorts.
These findings are especially significant, suggesting that a single factor, i.e., the BR factor, may help discern relative strength between similarly rated credits anchored in the bb – bbb range.
Drilling down: the BBB and BB rating categories
Let us now focus our analysis on the BBB rating category that includes the transition threshold from IG to SG, and on the BB rating category that includes the transition threshold from SG to IG.
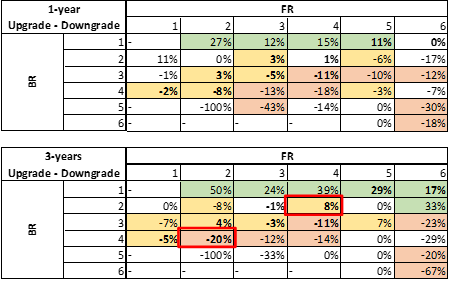
Table 2a and 2b include all possible (BR, FR) combinations historically observed for Corporates rated in the BBB and BB rating categories, respectively. Each cell reports the difference between historical frequency of upgrades and downgrades, over the specified time-horizon. For example, cell (1,2) in table 2.a shows that companies rated in the BBB rating category and with underlying excellent business risk and modest financial risk had 27% (50%) higher frequency of an ICR upgrade than a downgrade, over the 1-year (3-year) time-horizon. We highlight in bold cells where the anchor score and initial rating are the same (i.e. anchor group of ‘bbb’ and initial rating category of BBB) and in green, orange and red cases where the frequency of upgrades is significantly higher, similar or significantly lower than the downgrades.[7]
Table 2.a: ICR Upgrade minus downgrade frequency for BBB rating category

Source: RatingsXpress, S&P Global Market Intelligence. As of January 5, 2021. For illustrative purposes only.
Table 2.b: ICR Upgrade minus downgrade frequency for BB rating category

Source: RatingsXpress, S&P Global Market Intelligence. As of January 5, 2021. For illustrative purposes only.
In summary:
For the BBB initial rating category, in Table 2.a, we identify two distinctive areas where downgrades and upgrades are more frequent. We notice that a low financial risk profile does not necessarily translate into higher odds of an upgrade if it is not accompanied by a low business risk profile. In other words, this suggests that companies operating in a strong business environment have better prospects for good performance and thus improvement in their credit risk profile over both time horizon. The frequency of a rating movement increases with the extension of the time-horizon, as uncertainty increases with time. In the 3-year time horizon, we notice that the gap between upgrades and downgrades becomes more prominent vis-à-vis the 1-year time horizon. Also, within this time horizon (3-year), we notice that BR profile is a stronger driver of rating upgrades: for example, the (BR=2, FR=4) combination has higher frequency of upgrades than downgrades, and the opposite holds for the (BR=4, FR=2) combination.
For the BB initial rating category, in Table 2.b, we again see a similar behavior across both time horizons. For example, in the 3-year horizon, the (BR=5, FR=2) combination has higher (lower) frequency of a downgrade (upgrade) than the (BR=2, FR=5) combination.
In essence, the results in these tables suggest credit risk and investment managers may be able to construct their portfolios by selecting credits with specific (BR, FR) combinations that on average reduce (enhance) chances of a potential rating downgrade (upgrade) over a given time horizon.
Resilience in 2020
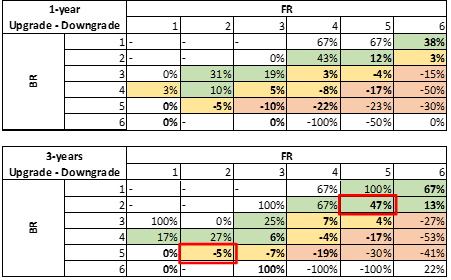
This analysis can be repeated for specific years and uncover to what extent rating movements are affected under different (e.g., stressed) macro-economic conditions. Since 2020 was heavily impacted by the COVID-19 pandemic and characterized by a severe global economic recession, it offers a great chance to study the interplay of (BR, FR) combinations and ratings moves under stressed conditions. Table 3 shows the frequency of rating changes for companies with initial rating in the BBB category at the end of 2019. We apply the same formatting as for Table 1.
Table 3: Rating change frequency for BBB rating category, during 2020.

Source: RatingsXpress, S&P Global Market Intelligence. As of January 5, 2021. For illustrative purposes only.
As expected, downgrades dominated rating moves over the 1-year time horizon (i.e., during 2020), across the vast majority of (BR, FR) combinations. However, even during the 2020 severe global recession some company ratings ended up being upgraded, especially where BR is lower.
Conclusion
The stability or change of an issuer credit rating is important for credit risk and portfolio managers to monitor. Using the newly added BR and FR factors provided in RatingsXpress, it can be seen how BR factors may influence future changes to a Corporate ICR. Understanding the historical frequency of upgrades or downgrades to ICRs for various combinations of BR and FR can provide a useful reference tool for managing bond or loan portfolios.
Regular updates of the (BR, FR) tables could help risk managers to do the following and more:
[1] Credit ratings are issued by S&P Global Ratings, which is analytically and editorially independent from any other analytical group at S&P Global.
[2] Please do note that lowercase is used to indicate anchor ratings which is different from uppercase ICR.
[3] Rating movement indicates next change to a rating in either direction (upgrade/downgrade) and notch size.
[4] We have used rated corporates from year 2014 to 2020, which have corresponding score & factors generated.
[5] We ignore anchor values above ‘a+/a’ and below ‘bb-‘ due to lack of multiple (BR,FR) combinations for the same anchor value.
[6] For the analysis where we combine all rating categories, we set a minimum threshold of 10 observations in the concerned (BR,FR) combination.
[7] The difference between the percentages should be at least 2% or include at least 3 rating changes.
Theme
Products & Offerings