S&P Global Offerings
Featured Topics
Featured Products
Events
S&P Global Offerings
Featured Topics
Featured Products
Events
S&P Global Offerings
Featured Topics
Featured Products
Events
Banking & Capital Markets
Economy & Finance
Energy Transition & Sustainability
Technology & Innovation
Podcasts & Newsletters
Banking & Capital Markets
Economy & Finance
Energy Transition & Sustainability
Technology & Innovation
Podcasts & Newsletters
S&P Global Offerings
Featured Topics
Featured Products
Events
Blog — 16 Jun, 2021
By Chady Abdelnour and Andrey Eliseev
This is the third in a series of three blogs on risk trends.
In our first blog, we analyzed the impact of the COVID-19 pandemic on the probability of default (PD) of non-financial corporates based in the Middle East, Africa, India, Turkey, and other emerging economies in Europe and Asia. We saw that the average PD of our study sample, based on year-end 2020 financial statements, stood at 12.7% compared to 9.7% against the year-end 2019 financial statements. In our second blog, we estimated the portfolio’s Loss Given Default (LGD), which is a measure of the severity of the loss if the borrower defaulted. LGD is an estimate of the portion of an exposure (bond or loan equivalent) that will likely not be recovered in the event of default. We found that the average LGD stood at 37% when measured against the year-end 2020 financials. In this final blog, we look at the expected credit loss (ECL), which is influenced by the combination of PD and LGD.
PD and LGD Combine to Produce ECL
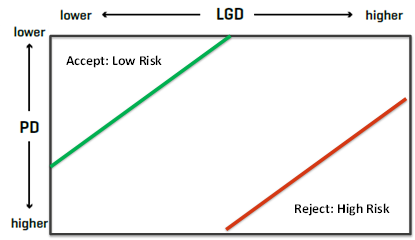
PD and LGD are important elements of credit risk that can be looked at separately and independently, enabling analysts to assess and manage the distinct risks in different ways.
Figure 1: PD and LDG Together Help Identify Attractive Opportunities

Source: S&P Global Market Intelligence. For illustrative purposes only.
The two concepts become even more relevant, however, when they are combined to generate the ECL for a given exposure. While there are different use cases for ECL, the International Financial Reporting Standard 9 (IFRS 9) stands out as a prominent one, with the standard requiring that financial instruments be impaired according to their ECL. IFRS 9 defines ECLs for a financial instrument as the difference between contractual cash flows due and the cash flows that are expected to be received.
ECL is calculated as follows:
ECL($) = PD(%) * LGD(%) * EAD(%)
Where: EAD is exposure at default, which is the total value a bank is exposed to when a loan defaults — an amount that constantly changes as borrowers pay down their loans. The main difference between LGD and EAD is that LGD takes into consideration any recovery on the default, say, for example, if a bank is able to sell the asset.
In our first blog, we saw that amongst 11 Global Industry Classification Standard (GICS) sectors, Consumer Discretionary showed the highest 2020PD average of c.15%, followed by Energy with an average 2020PD of 14%. In our second blog, we saw Energy having the highest average LGD at c. 60%. We also saw Utilities having an average LGD of 50%, although the sector had the lowest PD in the first blog. We combine the two views in Figure 2 below. Looking at a regional breakdown, we see that the ECL is the largest for Communication Services in Turkey, followed by Energy in Africa, and Energy in the emerging markets of Europe.
Figure 2: Expected Credit Loss Average Results 2020

Source: S&P Global Market Intelligence, as of 31 March 2021. For illustrative purposes only.
GCC: Gulf Cooperation Council; includes Bahrain, Kuwait, Oman, Qatar, Saudi Arabia, and the United Arab Emirates.
MENA: Middle East and North Africa.
Learn more about our PD Scorecards and LGD Scorecards.
Blog
Blog
Theme
Products & Offerings
