S&P Global Offerings
Featured Topics
Featured Products
Events
S&P Global Offerings
Featured Topics
Featured Products
Events
S&P Global Offerings
Featured Topics
Featured Products
Events
S&P Global Offerings
Featured Topics
Featured Products
Events
Language
Featured Products
Ratings & Benchmarks
By Topic
Market Insights
About S&P Global
Corporate Responsibility
Diversity, Equity, & Inclusion
Featured Products
Ratings & Benchmarks
By Topic
Market Insights
About S&P Global
Corporate Responsibility
Diversity, Equity, & Inclusion
S&P Dow Jones Indices — 20 Jan, 2021
Early in 2020, global stock markets acted in concert during the sell-off, bottoming out around the world in late March. However, the extent to which different markets declined, and the strength of the subsequent recovery, differed significantly around the world. With 2020 now in hindsight, S&P DJI’s range of global equity indices tell a tale of distinctive performances, as well as a returning importance of swings in the currency markets.
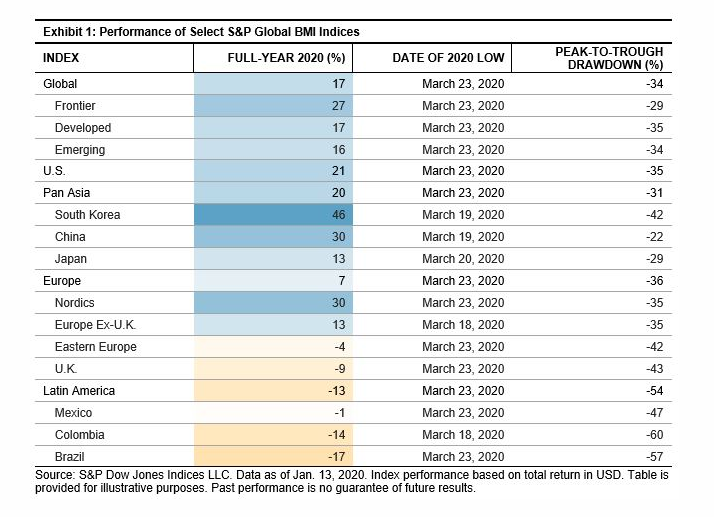
On the surface, it was a good year: the S&P Global BMI finished with a full-year total return of 17% in U.S. dollars, with both emerging and developed components performing similarly. However, Latin America, Eastern Europe, and the U.K. closed 2020 lower—driven by risk-off sentiment and an initial move to safety that led to their slower recoveries. Meanwhile, the Nordic markets outperformed, while China and South Korea soared.

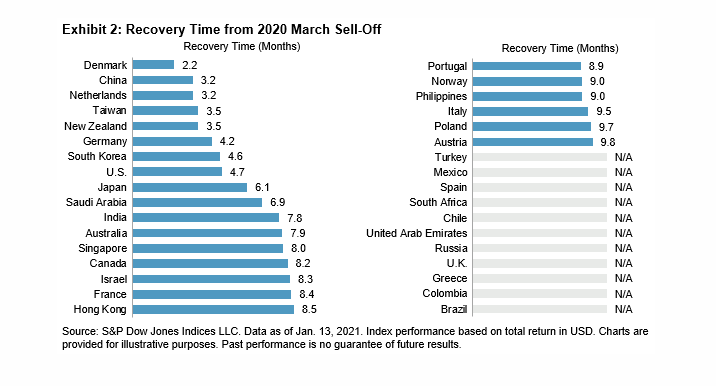
As shown in Exhibit 1, most of the 2020 lows occurred nearly simultaneously around March 23, 2020, but the scale of the drawdown, and the timing and speed of the recoveries, differed greatly.1 Exhibit 2 gives a more granular picture, plotting the time taken by a range of countries to get back to winning ways. Northern European countries were among the first to return to their highs, with Denmark taking just over two months to do so, and recovery times across the Scandinavian region averaging only four months. However, the global recovery really began with China: the S&P China BMI saw a smaller drawdown in March, setting a lower hurdle for redemption. The index took approximately three months to regain its losses—kicking off a wave of subsequent stock market highs. At the bottom of the spectrum, many Latin American countries and the U.K. still have some catching up to do.

Currency was a major factor in the performance of some markets, and Brazil in particular. In local currency terms, the S&P Brazil BMI had a respectable gain of 6%, but it declined 17% in U.S. dollar terms, driven by a 23% weakening of the Brazilian real (BRL) in 2020. A similar impact from currency meant 2020 gains dwindled when converted into U.S. dollars across several emerging markets, including Russia, Turkey, and Mexico. Part of this disparity was a result of the differences in the ability of countries to provide stimulus to their economies during the COVID-19 pandemic—as not every country could do “whatever it takes.”
Exhibit 3 shows that the currency markets hosted big winners as well. The S&P Europe BMI was lifted to a positive return (in U.S. dollar terms) entirely thanks to currency movements, after a 9% swing in the euro versus the U.S. dollar in 2020. There were similarly large moves for the greenback among a range of developed market currencies, including the Australian dollar (AUD) and the Nordic currencies (SEK and DKK).

Overall, 2020 was a rocky year for global markets, but with 2021 starting off on a positive note and signs of strong recoveries in the cyclical sectors that dragged down returns last year, we should see more country and regional equity markets fully recover from the 2020 sell-off and begin to write new stories for the year.
1 We define a recovery as the first point at which each index posted a new high for the year subsequent to its March 2020 low.
The posts on this blog are opinions, not advice. Please read our Disclaimers.
Content Type
Location
Segment
Language