S&P Global Offerings
Featured Topics
Featured Products
Events
S&P Global Offerings
Featured Topics
Featured Products
Events
S&P Global Offerings
Featured Topics
Featured Products
Events
Featured Products
Ratings & Benchmarks
By Topic
Market Insights
About S&P Global
Corporate Responsibility
Culture & Engagement
Investor Relations
Featured Products
Ratings & Benchmarks
By Topic
Market Insights
About S&P Global
Corporate Responsibility
Culture & Engagement
Investor Relations
S&P Global Offerings
Featured Topics
Featured Products
Events
Language
S&P Dow Jones Indices — 19 Aug, 2020
By Hong Xie
This article is reprinted from the Indexology blog of S&P Dow Jones Indices.
In its Q3 2020 refunding statement1 released on Aug. 5, 2020, the U.S. Treasury announced its plan to increase auction sizes across all nominal coupon tenors over the August-October quarter, with larger increases in longer tenors (7-year, 10-year, 20-year and 30-year).
To gauge the demand appetite for U.S. Treasuries, let’s review the size and composition of U.S. Treasury holdings by one of the larger buyers these days, the Federal Reserve. Since March 2020, the Federal Reserve has stepped in with a broad array of actions to limit the economic damage from the COVID-19 pandemic, including the resumption of security purchases. On March 23, 2020, the Fed made the purchases opened, saying it would buy securities “in the amounts need to support smooth marketing function and effective transmission of monetary policy to broader financial conditions.”
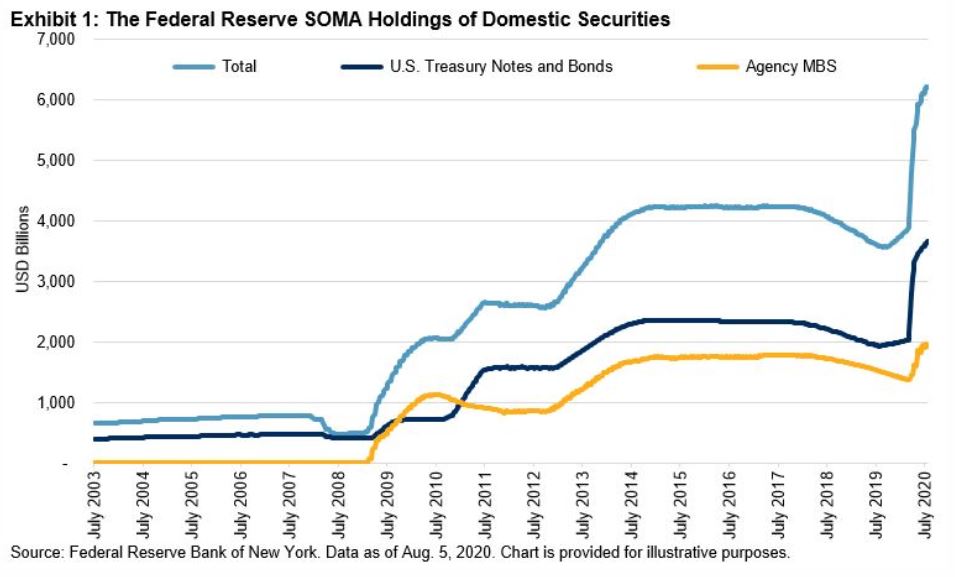
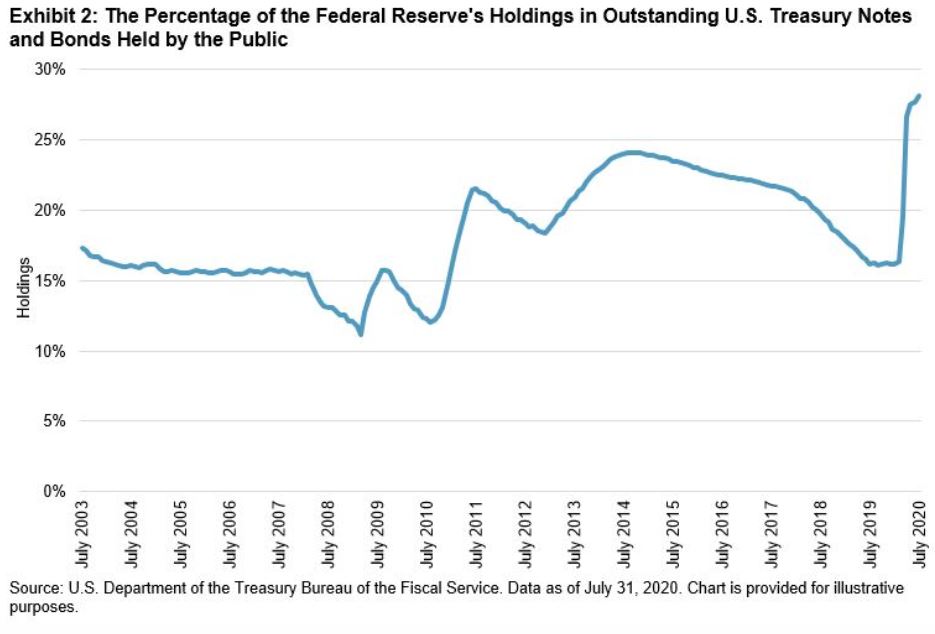
Exhibit 1 shows the significant increase of the Fed’s security holdings. Since the end of February 2020, the total amount of securities held in the Federal Reserve System Open Market Account (SOMA) increased from USD 3.8 trillion to USD 6.2 trillion, with 69% of that increase (USD 1.6 trillion) in U.S. Treasury notes and bonds. Exhibit 2 shows that as of the end of July 2020, the Federal Reserve held 28% of outstanding U.S. Treasury notes and bonds, the highest since 2003, compared with 11% in March 2009, when the Fed announced U.S. Treasury purchases in QE1.
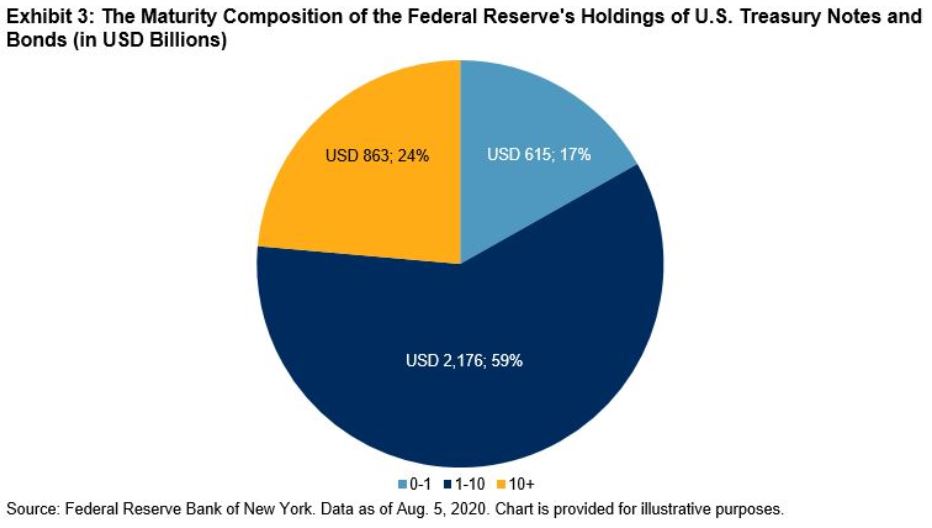
The increase in the Fed’s share of outstanding U.S. Treasuries since March 2020 shows that the Fed’s purchases have outpaced net issuances of U.S. Treasuries. However, looking closer at the composition of the Fed’s holdings, we find that 24% of its holdings are in U.S. Treasury bonds with maturities longer than 10 years, much lower than the 59% in U.S. Treasury notes with maturities between 1 and 10 years (see Exhibit 3).
As a result, the Fed’s aggressive purchases are not immediately easing pressure on long-dated U.S. Treasury yields. Since the refunding announcement to Aug. 14, 2020, the end of the week that included three auctions of 3-year, 10-year, and 30-year U.S. Treasury bonds, 10-year U.S. Treasury yields went up by 16 bps, while 30-year U.S. Treasury yields rose by 23 bps. Weak demand for the record-sized 30-year U.S. Treasury bond auction on Aug. 13, 2020, may indicate an early sign of indigestion. At the same time, a short position has been built up, as Commodity Futures Trading Commission data show net non-commercial positions in long bond futures (15-25 years) as of Aug. 11, 2020, were at a record high level since 2000.


Content Type
Location
Segment
Language
