Featured Topics
Featured Products
Events
S&P Global Offerings
Featured Topics
Featured Products
Events
S&P Global Offerings
Featured Topics
Featured Products
Events
S&P Global Offerings
Featured Topics
Featured Products
Events
Language
Featured Products
Ratings & Benchmarks
By Topic
Market Insights
About S&P Global
Corporate Responsibility
Culture & Engagement
Featured Products
Ratings & Benchmarks
By Topic
Market Insights
About S&P Global
Corporate Responsibility
Culture & Engagement
S&P Dow Jones Indices — 13 Mar, 2021
By Berlinda Liu and Gaurav Sinha
SUMMARY
The year 2020 was tumultuous for financial markets. The COVID-19 pandemic threw the world into chaos early in the year, with the S&P 500® falling 33.8% between Feb. 19, 2020, and March 23, 2020. Governments and central banks pulled out their playbooks from the global financial crisis of a decade earlier and acted swiftly to increase spending and ease monetary policy. Financial markets rapidly recovered, with the S&P 500 regaining its all-time high by August and ending the year up 18.4% after shrugging off U.S. election histrionics.
The torrent of liquidity depressed interest rates and pushed up asset prices nearly everywhere investors looked. Of the 31 distinct benchmarks tracked by this report, 30 finished with a positive return for 2020; the S&P United States REIT (-7.5%) was the only exception.
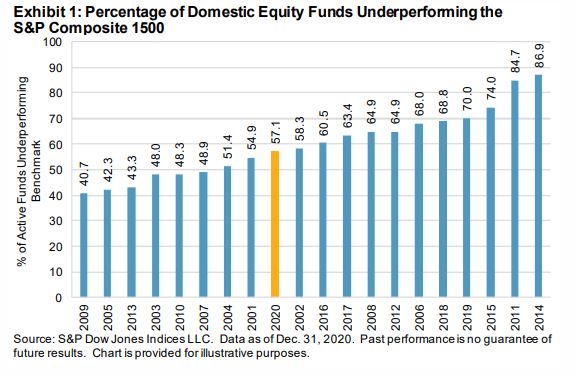
The positive market performance broadly translated into good absolute returns for active fund managers. While the turmoil and disruption caused by the pandemic should have offered numerous opportunities for outperformance, 57% of domestic equity funds lagged the S&P Composite 1500® during the one-year period ending Dec. 31, 2020.

Large-cap funds picked up where they left off the previous decade—for the 11th consecutive one-year period, the majority (60%) underperformed the S&P 500. Mid-cap (51%) and small-cap (46%) funds did somewhat better relative to the S&P MidCap 400® and S&P SmallCap 600®, respectively.
The ongoing growth versus value battle firmly tilted toward growth in 2020. The pandemic boosted the fortunes of those positioned to take advantage of changing lifestyles, with the S&P 500 Growth returning 33.5%, while the S&P 500 Value managed a meager 1.4%. A healthy 62% of large-cap growth funds, 83% of mid-cap growth funds, and 86% of small-cap growth funds topped the S&P 500 Growth, S&P MidCap 400 Growth, and S&P SmallCap 600 Growth, respectively. However, this did little to improve their longer-term relative performance, as on a 20-year horizon a paltry 4%, 10%, and 6% of large-, mid-, and small-cap growth funds beat their benchmarks, respectively.
Active value funds posted more mixed results. While 67% of large-cap value funds beat the S&P 500 Value, just 47% of mid-cap value funds and 56% of small-cap value funds were able to do so. Nevertheless, 20-year results showed a similar decline to growth funds, as just 23%, 15%, and 24% of large-, mid-, and small-cap value funds outperformed their benchmarks, respectively.
For U.S. funds looking outside of the country, relative results in 2020 were a toss-up. Roughly 50% of global, international, international small-cap, and emerging markets funds beat the S&P Global 1200, S&P International 700, S&P Developed Ex-U.S. SmallCap, and S&P/IFCI Composite, respectively. This clustering artifact remained, but the poor results widened when viewed over three years (about 60% underperforming), five years (about 70%), or 20 years (about 90%).
Gorging on central bank largesse, the long-tenor bonds of the Bloomberg Barclays US Government Long returned a spectacular 17.6% for the year. The government long funds charged with targeting this index failed in spectacular fashion, as fewer than 6% were able to clear this hurdle. In 3 of the 14 fixed income categories tracked (government long funds, investment-grade long funds, and loan participation funds), more than 90% of funds failed to clear their benchmarks in 2020. Better results were generally found in the intermediate and shorter-dated tenors for 2020.
Echoing the results from equities, longer observation horizons offered little sanctuary. More than 60% of funds underperformed their benchmarks across all fixed income categories over the 15-year horizon; in 10 of the 14 categories tracked, more than 80% of funds came up short.
The SPIVA Scorecard's accounting for survivorship bias continues to be a valuable cautionary tale. As has generally been the case in recent years, roughly 5%-10% of funds across asset classes and categories were merged or liquidated in 2020. Over 20 years, nearly 70% of domestic equity funds and two-thirds of internationally focused equity funds across segments were confined to the history books.
Content Type
Theme
Location
Language