Featured Topics
Featured Products
Events
S&P Global Offerings
Featured Topics
Featured Products
Events
S&P Global Offerings
Featured Topics
Featured Products
Events
S&P Global Offerings
Featured Topics
Featured Products
Events
Language
Featured Products
Ratings & Benchmarks
By Topic
Market Insights
About S&P Global
Corporate Responsibility
Culture & Engagement
Featured Products
Ratings & Benchmarks
By Topic
Market Insights
About S&P Global
Corporate Responsibility
Culture & Engagement
S&P Dow Jones Indices — 10 Dec, 2020
By Anu Ganti
This article is reprinted from the Indexology blog of S&P Dow Jones Indices.
When we think about reversals in the market, we likely think of brief turnarounds in performance. But what if it’s more? What makes a reversal turn into a recovery is a full-fledged long-term improvement in performance.
We can apply this logic to Equal Weight’s recent experience. After consistent underperformance since April 2017, the S&P 500® Equal Weight Index experienced a reversal in the past two months, outperforming the S&P 500 by 2% in October and by 3% in November. As Exhibit 1 shows, Equal Weight reduced its 12-month underperformance versus the S&P 500 by half to 6.2%, compared to August, when underperformance had dipped to 13.5%.

This reversal was primarily driven by strength in smaller caps, as Equal Weight has a small-cap bias. Another tailwind was the recent underperformance of the Technology sector, since Equal Weight has a significant underweight to Tech, which was flat over the past three months, compared to a gain of 4% for the S&P 500.
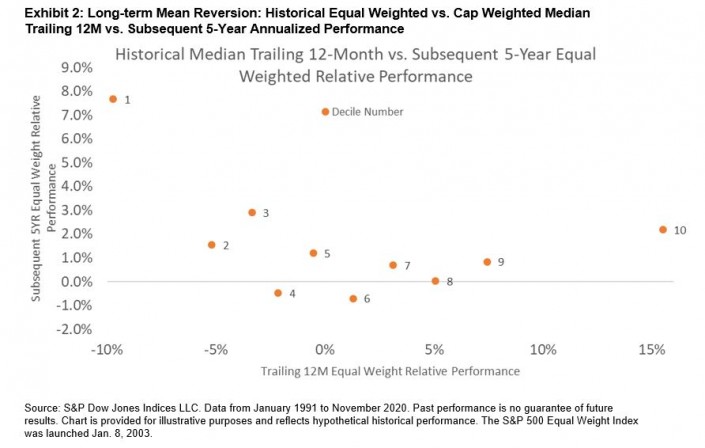
To provide historical context, we do know that Equal Weight outperforms over the long-term, and that there is a general trend of mean-reversion from observing the peaks and troughs in Exhibit 1. Equal Weight’s trailing 12-month relative performance versus the S&P 500 has a mean value of 1.2% and a standard deviation of 7.6%. Of course, on its own this doesn’t tell us whether Equal Weight’s recent performance is a temporary blip or the start of a new cycle of outperformance. To understand this long-term outperformance and the mean-reversion effect, we ranked the months in our database by the 12-month relative performance of Equal Weight and divided them into deciles. Then, we analyzed the median subsequent 5-year annualized performance in each of these deciles.
The results in Exhibit 2 show that we indeed see a reversion to the mean over the long-term: Lower decile months tend to outperform in the future, while higher deciles tend to underperform. Decile 1, or the worst performing decile for Equal Weight, had the best subsequent median 5-year performance, outperforming by 8%.

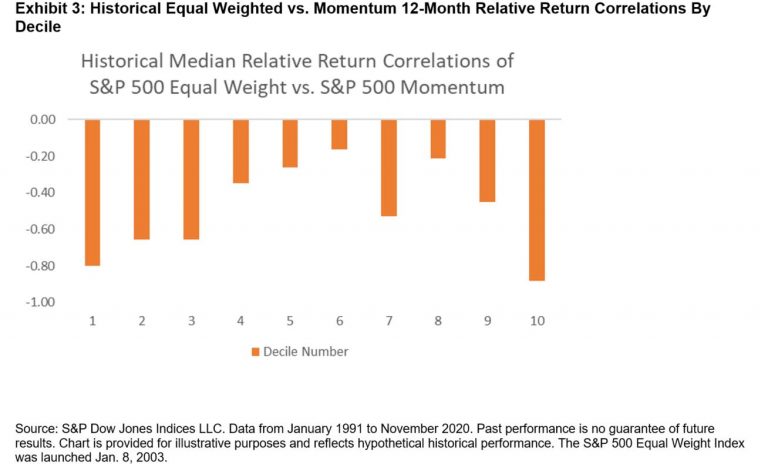
In addition, Equal Weight has a natural anti-momentum bias, as by definition the strategy sells relative winners and purchases relative losers at each rebalance. To measure the strength of this bias in the above mean-reversion analysis, we calculated the median 12-month relative return correlations of S&P 500 Equal Weight versus S&P 500 Momentum in each of the deciles. Exhibit 3 illustrates that Decile 1, in addition to having the best subsequent median 5-year performance, also had the second-greatest negative correlation of Equal Weight versus Momentum.

To put things in perspective, Equal Weight’s relative performance for most of this past year was in Decile 1, and its correlation versus Momentum has been strongly negative, consistent with what we observe in Exhibit 3. The recent underperformance of Momentum as well as the analysis from Exhibit 2 tell us that times of severe underperformance for Equal Weight can bode well for future outperformance. Similar episodes have occurred in the past. Time will tell whether Equal Weight’s recent outperformance moves from a reversal into a sustained recovery.
The posts on this blog are opinions, not advice. Please read our Disclaimers.
Content Type
Location
Language