S&P Global Offerings
Featured Topics
Featured Products
Events
S&P Global Offerings
Featured Topics
Featured Products
Events
S&P Global Offerings
Featured Topics
Featured Products
Events
S&P Global Offerings
Featured Topics
Featured Products
Events
Language
Featured Products
Ratings & Benchmarks
By Topic
Market Insights
About S&P Global
Corporate Responsibility
Diversity, Equity, & Inclusion
Featured Products
Ratings & Benchmarks
By Topic
Market Insights
About S&P Global
Corporate Responsibility
Diversity, Equity, & Inclusion
S&P Dow Jones Indices — 17 Nov, 2020
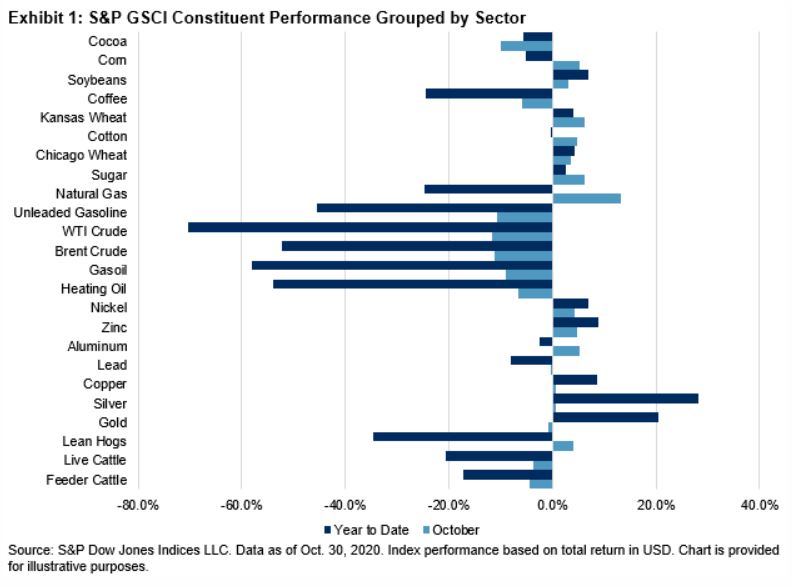
Discussions regarding a K-shaped recovery from COVID-19 highlight disparities across different commodity sectors. India seems to be experiencing its own version of this, with some areas improving faster and stronger than others. Decreased importation costs have served as a tailwind to help India. Energy accounts for about one-third of India’s total imports, and as crude oil prices collapsed around the world from the simultaneous demand and supply shock, India found that the cost of doing business dropped significantly. Most commodity prices dipped in the first half of the year, following moves in other asset classes. Exhibit 1 shows the YTD and October 2020 performance of the 24 constituents in the S&P GSCI. Grouped by sector, the negative YTD performance of the energy-related commodities clearly stands out; however, the other sectors seem to be rounding the turn.

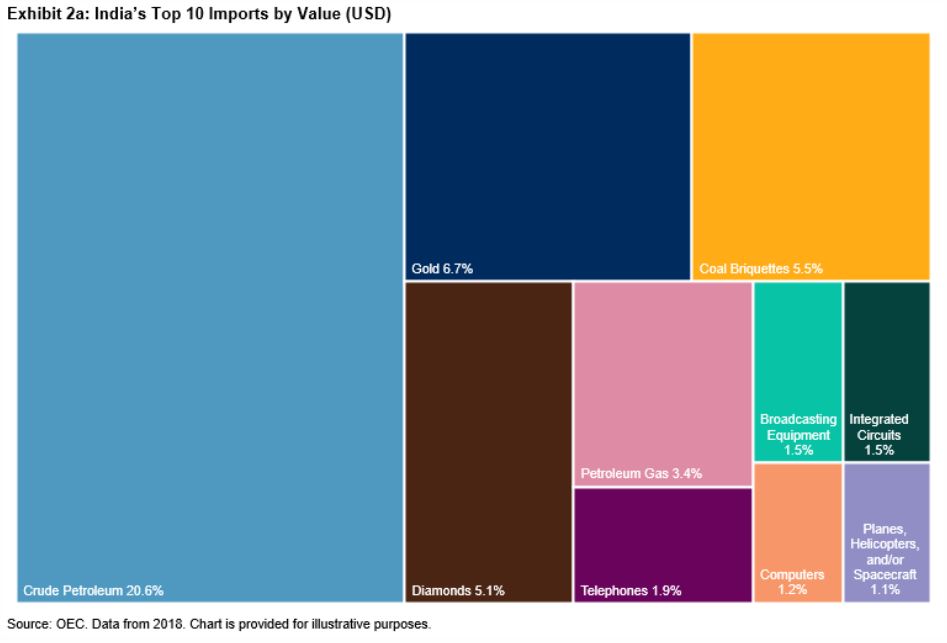
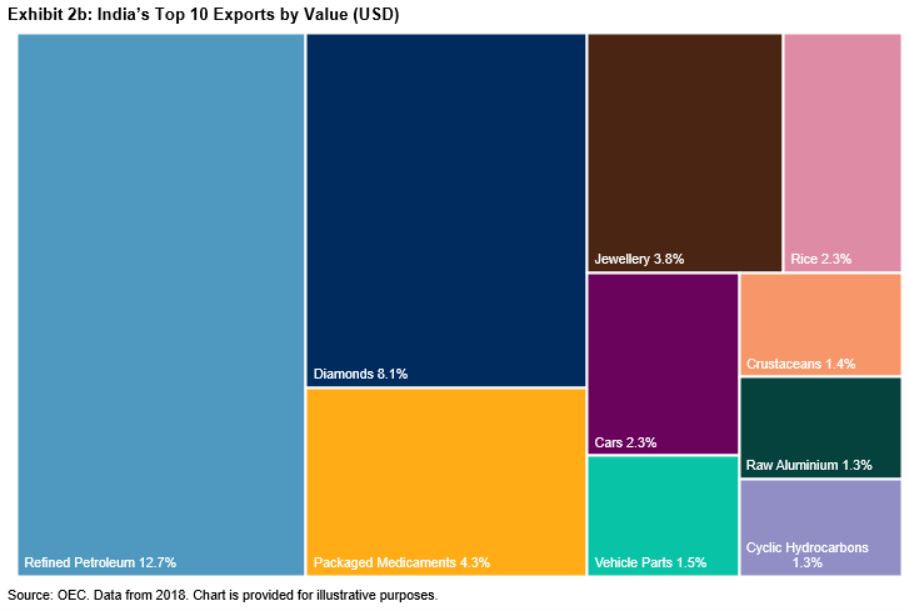
Before dissecting the current situation, it is important to put India’s trade relationships and major commodity exports and imports in a global context. With China’s dominance in world trade, it would be intuitive to think it has an outsized trading relationship with India, but China only made up approximately 15% of total imports as of 2018. China is India’s largest trading partner, but after that, imports are more evenly distributed across many trading partners. The most prominent destination for Indian exports is the U.S. Approximately 20% of exports to the U.S. consist of diamonds, jewelry, and precious metals.


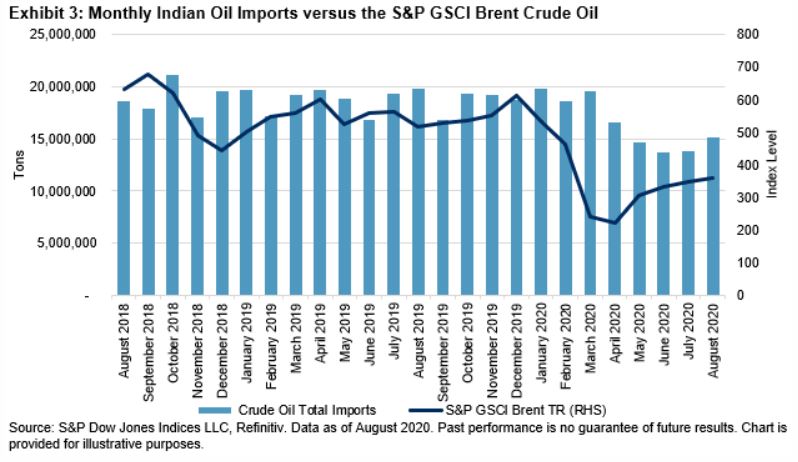
Crude petroleum and gasoline have traditionally made up 25% of India’s imports. Crude petroleum imports fell dramatically from April 2020 through July 2020, as the Indian government enacted one of the world’s most stringent lockdowns in response to COVID-19. While weaker global oil prices have been beneficial, the pickup in demand has been slow. Crude petroleum imports recovered notably in August but remain well below previously levels. On a positive note, gasoline demand hit a seven-month high in September.

Gold imports have also fallen sharply since March. According to the World Gold Council, gold demand in India fell by 30% during Q3 2020, compared with the same period last year, due to COVID-19-related disruptions and surging gold prices. While this was an improvement from demand in Q2 2020, which was down 70% year-over-year, it continues to reflect weak consumer sentiment, ongoing lockdown restrictions, and record gold prices.
From an export perspective, there may be some signs of improvement, especially for agricultural commodities. Global demand for rice and sugar is expected to grow, and both are commodities that have seen increased production in India in recent years. Bumper wheat crops over recent years also put India in a strong position to take advantage of surging global wheat prices.
When looking for clues to where an economy may be recovering or taking another turn for the worse, commodities tend to be good indicators of what is improving or deteriorating. The S&P GSCI provides market participants with a useful tool to reference when attempting to understand commodity markets, just as the S&P 500® is used to showcase U.S. equity market performance.
The posts on this blog are opinions, not advice. Please read our Disclaimers.
Content Type
Segment
Language