S&P Global Offerings
Featured Topics
Featured Products
Events
S&P Global Offerings
Featured Topics
Featured Products
Events
S&P Global Offerings
Featured Topics
Featured Products
Events
S&P Global Offerings
Featured Topics
Featured Products
Events
Language
Featured Products
Ratings & Benchmarks
By Topic
Market Insights
About S&P Global
Corporate Responsibility
Diversity, Equity, & Inclusion
Featured Products
Ratings & Benchmarks
By Topic
Market Insights
About S&P Global
Corporate Responsibility
Diversity, Equity, & Inclusion
S&P Dow Jones Indices — 5 Jun, 2020
By Hong Xie
This article is reprinted from the Indexology blog of S&P Dow Jones Indices.
Since March 2020, the federal government has enacted four pieces of legislation to assist businesses and individuals weather the economic downtown triggered by the COVID-19 outbreak. According to the Congressional Budget Office (CBO), these four pandemic-related laws are projected to increase the federal deficit by USD 2.2 trillion in fiscal year 2020 and by USD 0.6 trillion in fiscal year 2021. Those amounts would represent 11% of nominal GDP in fiscal year 2020 and 3% in fiscal year 2021. In late April 2020, the CBO adjusted the projected deficit to be 17.9% of GDP in 2020 and 9.8% in 2021, figures that were 13.3% and 5.5% higher, respectively, than projected in the initial January 2020 report (see Exhibit 1).

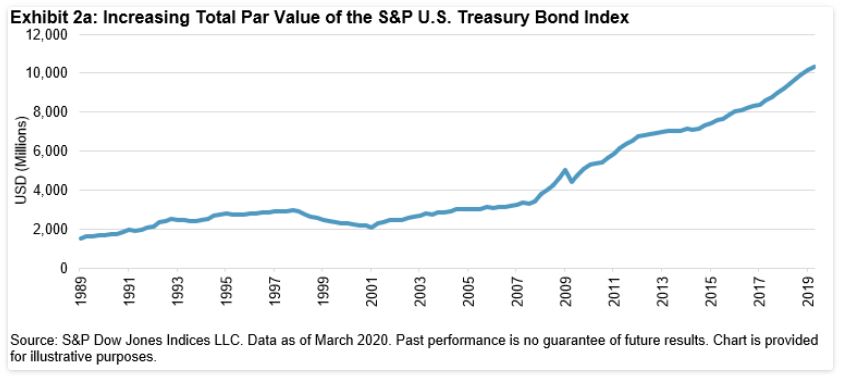
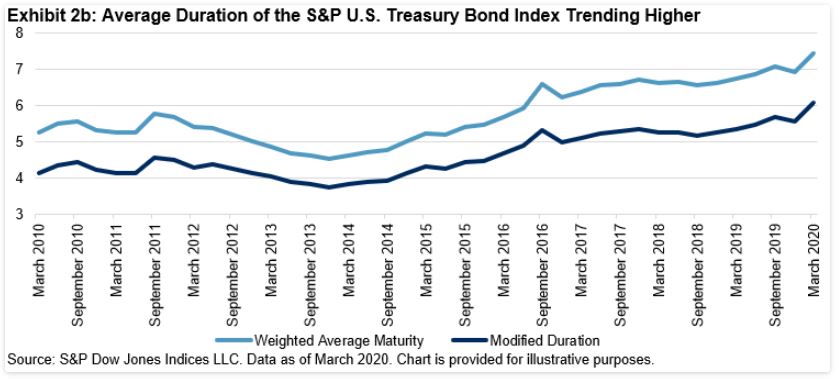
As stated in the latest U.S. Treasury quarterly refunding statement released on May 6, 2020, the U.S. Treasury has increased borrowing needs substantially as a result of the federal government’s response to the COVID-19 outbreak and expects to begin to shift financing from bills to longer-dated tenors over the coming quarters. In fact, the market size and average duration of outstanding U.S. Treasury securities had been steadily increasing even before the COVID-19 outbreak (see Exhibits 2 and 3). Now, both should continue to trend higher.


Increased funding needs and the shift of some issuance to a longer tenor from U.S. Treasury bonds mean more duration supply from U.S. Treasury securities. How has the market weathered this increased supply and the expectation of more supply over the coming quarters?
As the Federal Reserve revamped its large-scale asset purchase program at the same time, the bond market has absorbed the supply fairly well. From March 11, 2020, to May 27, 2020, securities held outright by the Federal Reserve increased from USD 3.9 trillion to USD 5.9 trillion. Exhibit 3 shows the 10-year U.S. government bond yield and rolling one-month realized yield volatility (annualized) since March 1, 2020. The 10-year U.S. Treasury yield jumped by 50 bps within a couple of days in mid-March 2020, but since then it has been trading in a tight range. Realized yield volatility has dropped back to the norm of the post-GFC low.

So far, the Fed’s bond purchasing program has been successful in capping yield and keeping yield volatility low. However, the substantial increase in the supply of U.S. Treasuries has opened up the upside risk of interest rates significantly, particularly given the Fed’s reluctant stance on negative rates. Looking forward, U.S. Treasury auctions and their results will continue to be closely monitored by market participants to gauge market appetite for duration supply.
Content Type
Theme
Location
Language