S&P Global Offerings
Featured Topics
Featured Products
Events
S&P Global Offerings
Featured Topics
Featured Products
Events
S&P Global Offerings
Featured Topics
Featured Products
Events
S&P Global Offerings
Featured Topics
Featured Products
Events
Language
Featured Products
Ratings & Benchmarks
By Topic
Market Insights
About S&P Global
Corporate Responsibility
Diversity, Equity, & Inclusion
Featured Products
Ratings & Benchmarks
By Topic
Market Insights
About S&P Global
Corporate Responsibility
Diversity, Equity, & Inclusion
S&P Dow Jones Indices — 23 May, 2020
By Akash Jain
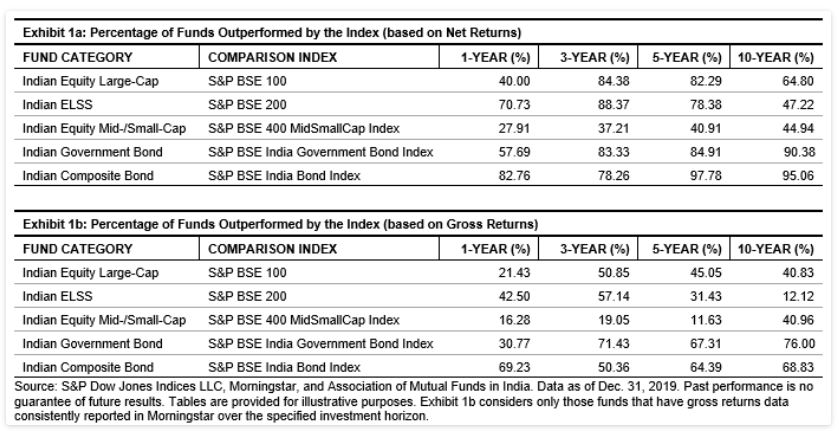
The SPIVA® India Year-End 2019 Scorecard shows that, over longer horizons, a large proportion of active funds underperform their respective category benchmarks (see Exhibit 1a). The SPIVA India Year-End 2019 Scorecard evaluates the performance based on net-of-fees returns (i.e., gross returns less the management fees). But do active fund managers fare better when evaluated based on gross returns? In this blog, we have evaluated the results of the SPIVA India Year-End 2019 Scorecard on a gross-return basis (see Exhibit 1b). One can notice that in most categories, even without the deduction of management fees, still a fairly large percentage of active funds failed to beat their benchmarks. For example, over the 10-year horizon, more than 40% of active funds in the large-cap and mid-/small-cap categories underperformed the S&P BSE 100 and S&P BSE 400 MidSmallCap Index, respectively (see Exhibit 1b). Even the government and composite bond categories had over 65% of their funds underperform their respective benchmarks based on gross returns. An investor may therefore be wary of paying a management fee in return for worse-than-benchmark fund returns even on a gross-return basis.
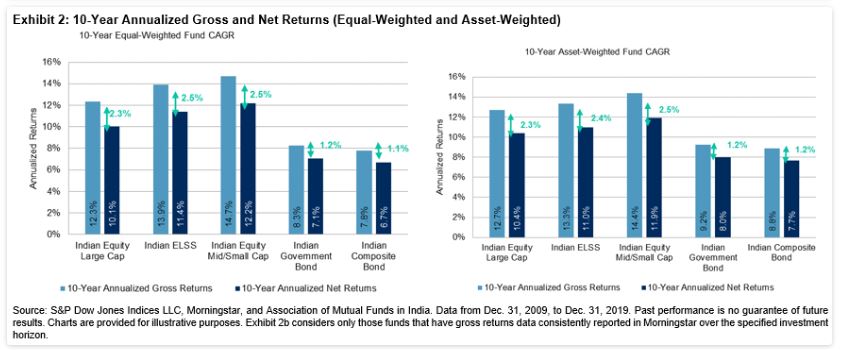
Exhibit 2 shows the 10-year annualized gross and net-of-fees returns for each category on an equal-weighted basis, while Exhibit 2b shows the same but based on an asset-weighted basis (i.e., returns are weighted by funds’ AUM); Exhibit 2 reflects the returns for every dollar amount invested in that category. The difference between the gross CAGR and net CAGR is a proxy of the annualized management fees paid by investors during the 10-year period from Dec. 31, 2009, to Dec. 31, 2019. With this estimation, investors, on average, paid 230 bps annually in management fees in the Indian Equity Large-Cap category over the 10-year period. In the ELSS and mid-/small-cap categories, investors paid higher expenses to the tune of approximately 250 bps per year over the same period.
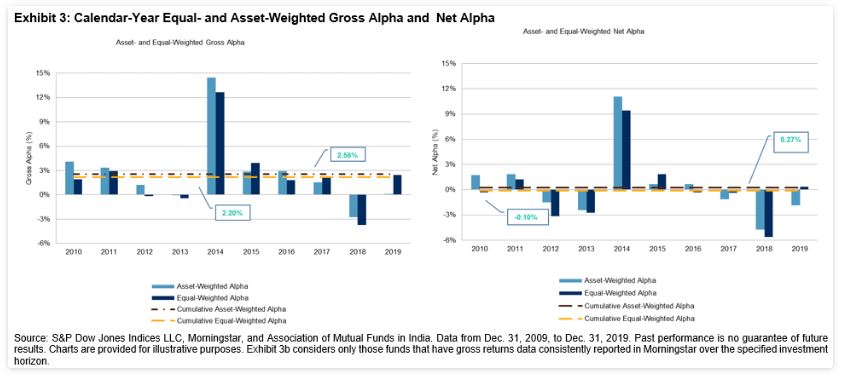
To analyze if the alpha[1] generation of fund returns over the benchmark was consistent over the years for the Indian Equity Large-Cap category, we dissect the asset- and equal-weighted gross and net fund returns into calendar year performance. Exhibit 3 shows the calendar-year gross alpha (evaluated both on equal- and asset-weighted returns) for the Indian Equity Large-Cap category versus the benchmark S&P BSE 100. We see that on an average gross-return basis, fund managers delivered positive alpha for the majority of the years, though not consistently throughout history, with the worst relative performance seen in 2012, 2013, and 2018 (see Exhibit 3). Also in an earlier blog, we had evaluated in which phases of the market cycles it is more probable for fund managers to generate alpha and under which conditions they typically underperform.
The annualized gross return alpha in the Indian Equity Large-Cap category was around 256 bps and 220 bps on an asset-weighted and equal-weighted basis, respectively (see Exhibit 3). However, these return alphas would be eroded by the annualized management fee of 230 bps (as estimated earlier in this blog), and an average large-cap fund investor would be left with a net return alpha of only 27 bps and -10bps per year on an asset-weighted and equal-weighted basis, respectively.
In conclusion, the alpha generation by fund managers in the Indian Large-Cap Equity category were largely eroded by the fees they charged, resulting in marginal or even negative average net excess return over the long-term investment horizon compared to the benchmark. Even on a gross-return basis, a significant proportion of funds underperformed the benchmark, posing challenges on fund selection and investment style changes. As an outcome, we have seen growing assets in passive investment products, which tend to be more style consistent and cost effective.


[1] Gross alpha = gross returns – benchmark returns; net alpha = net returns – benchmark returns; net returns = gross returns – management fees.
Content Type
Theme
Location
Language