S&P Global Offerings
Featured Topics
Featured Products
Events
S&P Global Offerings
Featured Topics
Featured Products
Events
S&P Global Offerings
Featured Topics
Featured Products
Events
Featured Products
Ratings & Benchmarks
By Topic
Market Insights
About S&P Global
Corporate Responsibility
Culture & Engagement
Investor Relations
Featured Products
Ratings & Benchmarks
By Topic
Market Insights
About S&P Global
Corporate Responsibility
Culture & Engagement
Investor Relations
S&P Global Offerings
Featured Topics
Featured Products
Events
Language
9 Jan, 2020
By Liyu Zeng, Priscilla Luk, and Sun Yan
China’s economy is shifting from being primarily focused on investment and manufacturing to a consumption- and services-driven market. In this paper, we use the S&P New China Sectors Index(opens in a new tab) to analyze China’s growing economic sectors and examine their equity, fundamental, and price performance characteristics.
As the second-largest economy in the world, China generated approximately 18.7% of global GDP in 2018. 2 However, China’s economic growth has slowed steadily since the global financial crisis in 2008, despite a temporary boost in 2010 following government stimulus measures. 3 In 2018, China’s economy grew at its slowest pace since 1990, at 6.57%, and it is expected to continue to slow down over the next six years. 4
Industrial production and investment, the two engines of the country’s past momentous economic growth, have geared down since 2011 and 2010, respectively (see Exhibit 1).
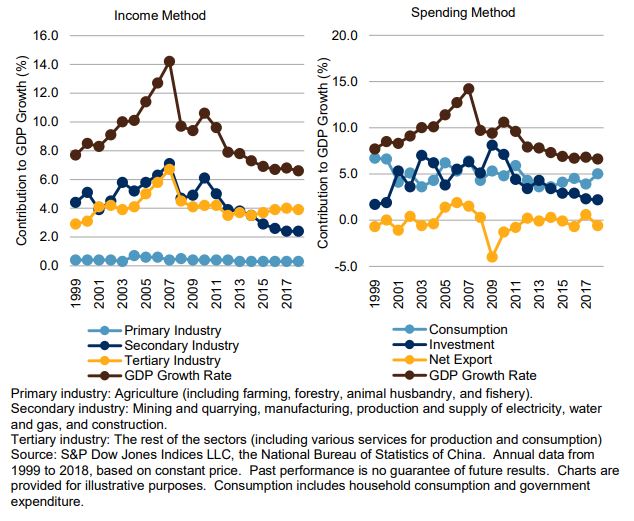
In response to the economic slowdown, the Chinese government has been carrying out structural reforms and promoting initiatives to support more sustainable economic growth by transforming the country from an investment- and manufacturing-driven economy to a consumption- and services-fueled new economy.
2 Based on purchasing-power-parity (PPP) share of world total and IMF data.
3 National Bureau of Statistics of China.
4 Based on 2018 data from the IMF’s World Economic Outlook Report, April 2019
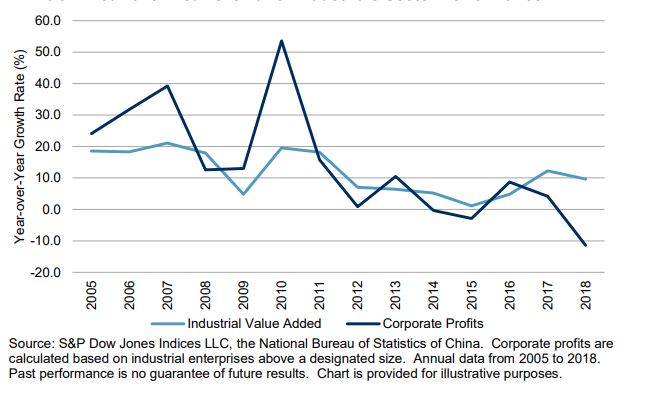
With deepening concern surrounding the economic structural imbalances and increasing corporate financial risks due to years of monetary and fiscal stimulus, in February 2016, the Chinese government initiated a supply-side structural reform with five goals: reducing excess industrial capacity, destocking housing inventories, curbing the high level of corporate debt, lowering corporate costs, and correcting other structural shortcomings.5 Following the implementation of the restructure measures, China’s Industrials sector had a temporary rebound in the growth of the industrial value added and corporate profits in 2016. However, corporate profits resumed their declining pace in 2017 (see Exhibit 2).
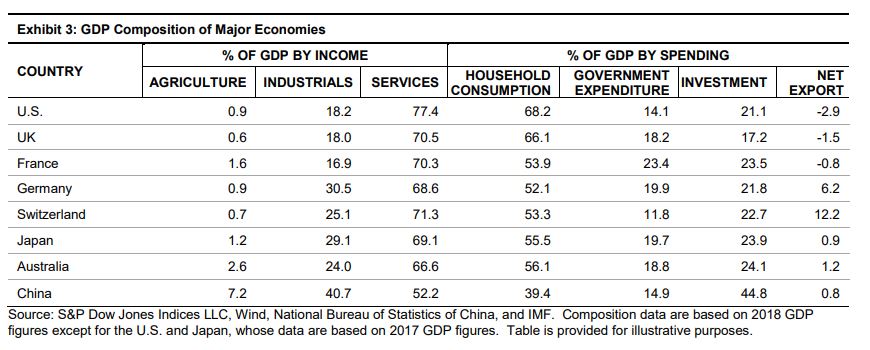
Benefitting from rising household income and technological advances such as internet and mobile services, which stimulated new ways of spending, consumption and services have emerged to be the new engines for more balanced and sustainable economic growth since 2015 (see Exhibit 1). In 2018, 5.0% and 3.9% out of the 6.6% GDP growth rate was driven by consumption and services, respectively. However, compared to developed economies, the contributions to GDP from household consumption and services remained low, suggesting ample room for further development in the future (see Exhibit 3).
5 China’s supply-side structural reforms: Progress and outlook(opens in a new tab), The Economist Intelligence Unit, 2017.
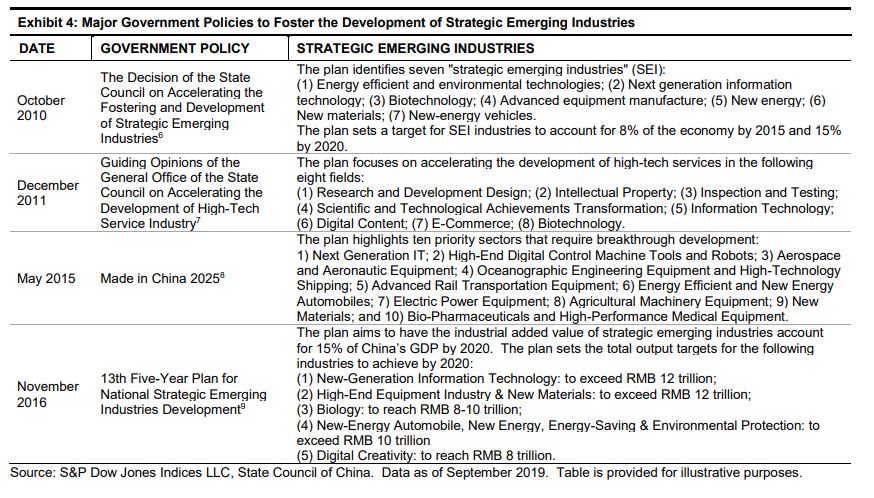
In searching for new growth, and with the recognition of the importance and urgency of developing emerging industries with high value added and growth potential, the Chinese government established a series of guidelines and measures to support the development of identified strategic emerging industries and high-technology services since 2010 (see Exhibit 4).
6 No.32 [2010] of the General Office of the State Council. http://www.gov.cn/zwgk/2010-10/18/content_1724848.html.
7 No. 58 [2011] of the General Office of the State Council. http://www.gov.cn/zwgk/2011-12/16/content_2021875.html.
8 No.28 [2015] of the General Office of the State Council. http://www.cittadellascienza.it/cina/wp-content/uploads/2017/02/IoT-ONE-Made-inChina-2025.pdf.
9 No.67 [2016] State Council of China, 2016 No.67. http://www.gov.cn/zhengce/content/2016-12/19/content_5150090.html.
These policies aim to have the industrial added value of strategic emerging industries account for 15% of China’s GDP by 2020. In particular, the government identified five strategic emerging segments with a potential market size of over RMB 10 trillion and set up articulated development goals to be achieved by 2020. To this end, the government will provide funding and tax incentives to encourage venture investment, calling for active support for qualified strategic emerging enterprises to obtain direct financing from the capital market.
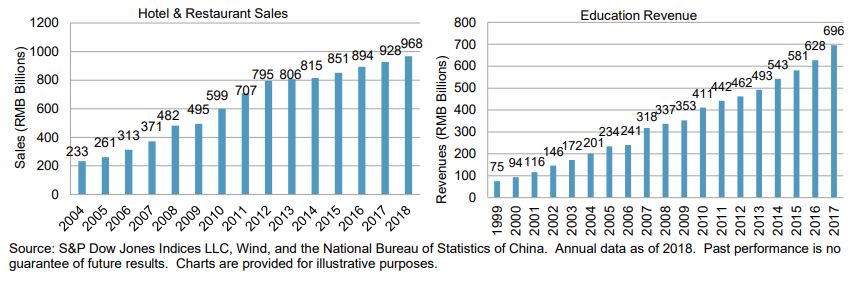
Consumer Discretionary, Consumer Staples, Communication Services, Health Care, Insurance, and Independent Power and Renewable Electricity Producers are the main sectors benefiting from the policy shift. According to the 2018 economic report from the National Bureau of Statistics of China, China’s per capita GDP and household disposable income hit RMB 64,644 and RMB 28,288, respectively. Domestic consumption contributed to 54.3% of GDP and 75.8% of GDP growth in 2018. Total retail sales of consumer goods hit RMB 38.1 trillion. Over 28 million cars were sold in China in 2018, with retail sales of RMB 3.9 trillion. The upgrade of consumption was also reflected in the steady growth trend of travel expenditure, hotel and restaurant sales, and education expenses (see Exhibit 5).

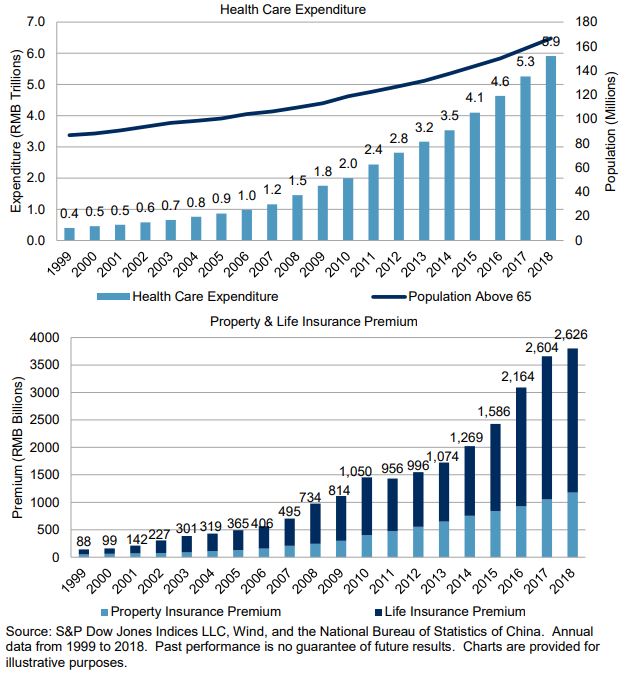
With the aging population, national health care expenditure grew steadily, amounting to RMB 5.9 trillion in 2018, and it is expected to continue to grow. The demand for insurance services, especially life insurance, had a compounded double-digit growth in the past five years (see Exhibit 6).
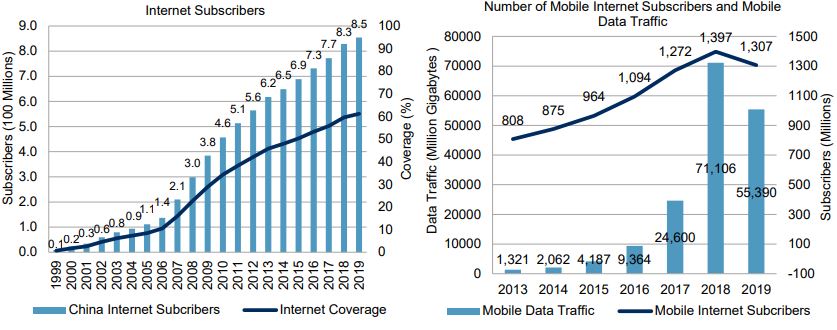
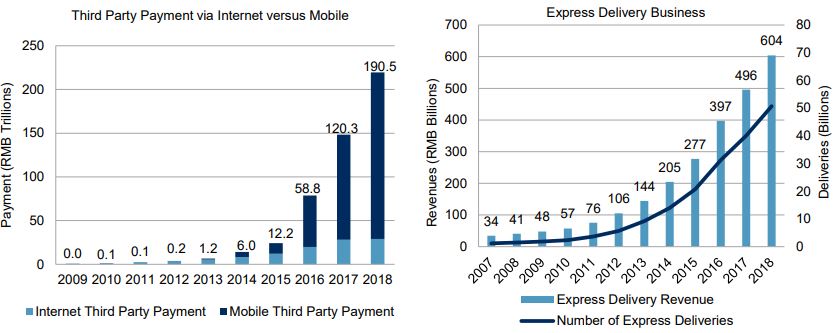
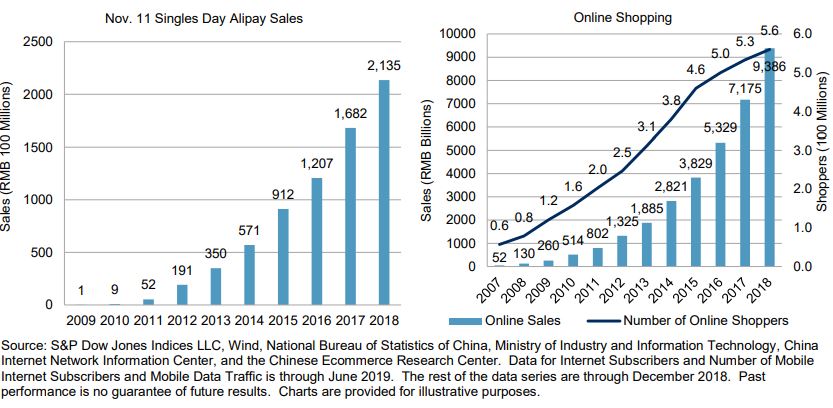
As a result of the well-established national internet infrastructure, China has surprisingly high coverage for internet usage, at 61.2% as of mid-2019. With 1.3 billion smartphone subscribers and 854.5 million internet users, China has become the leader of e-commerce globally. In 2018, there were approximately 560 million online shoppers in China, which generated retail sales of RMB 9.39 trillion. On Alibaba’s November 11 Singles’ Day in 2018, sales revenue amounted to RMB 213.5 billion. Enjoying the spill-over effect, in 2018, the express delivery business achieved revenue worth RMB 603.8 billion, while third-party payment providers generated transaction volume as high as RMB 219.6 trillion (see Exhibit 7).
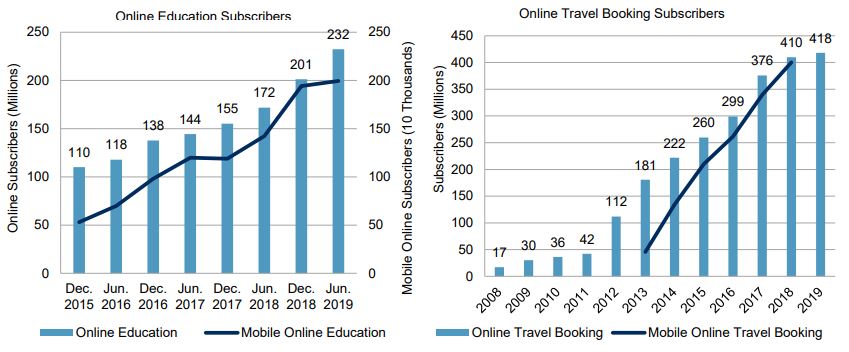
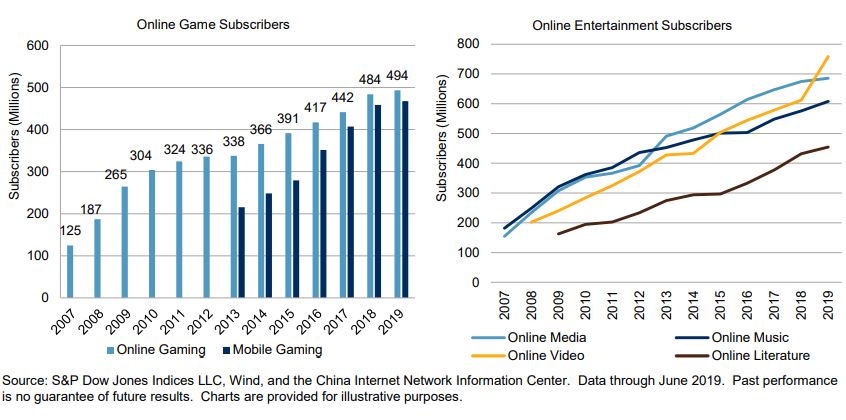
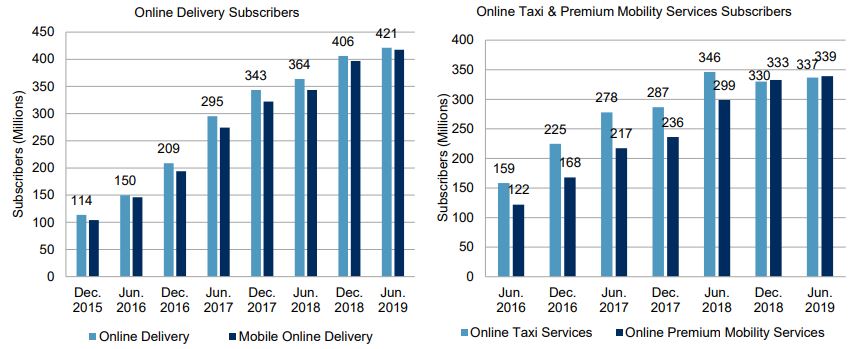
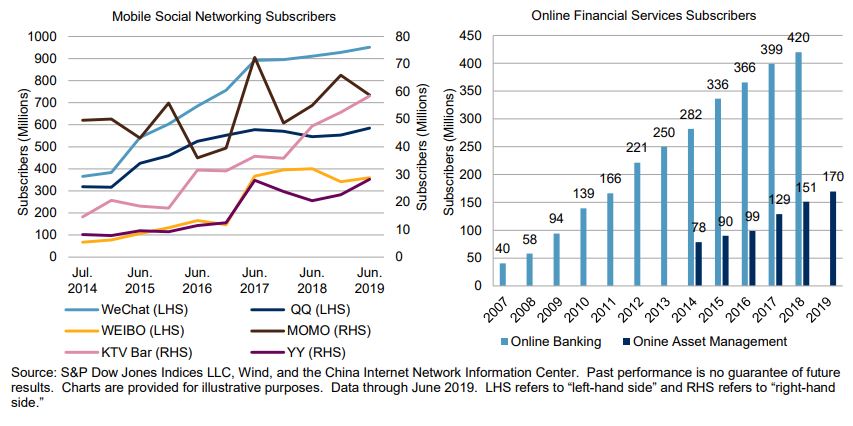
Advances in internet and mobile technology fostered the proliferation of innovative businesses that brought revolutionary changes to people’s daily and social life. An online presence in education, travel booking, games and entertainment, delivery services, taxi & premium mobility services, and financial services showed impressive growth and potential for more online services (see Exhibit 8).
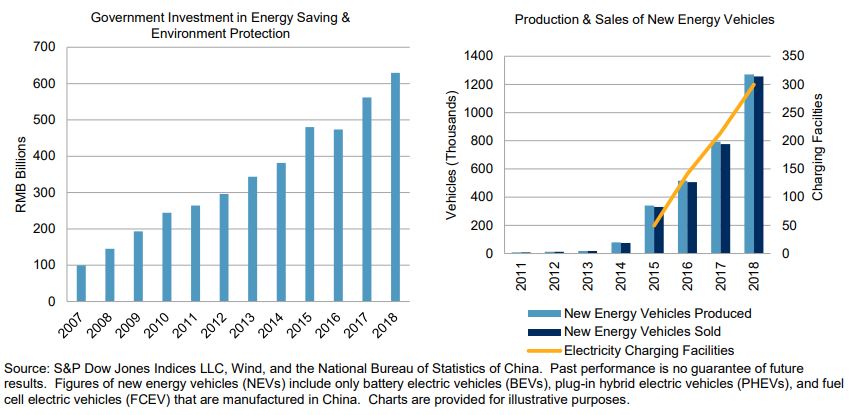
Viewed as strategic emerging industries, environmental protection, energy conservation, and new energy technologies have gained strong government support. For example, the production and sales of new energy vehicles have seen significant growth, with double-digit rates over the past four years (see Exhibit 9).
As China’s economic structural reforms deepen, the demand for benchmarks tracking the sector drivers of China’s new economy has increased. In response to this demand, the S&P New China Sectors Index was launched to provide equity insight into the new economy sectors.
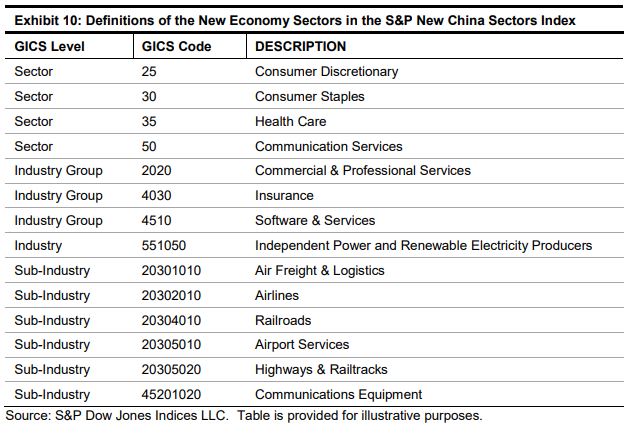
The S&P New China Sectors Index is designed to measure all constituents of the S&P Total China + Hong Kong BMI Domestic10 that are incorporated in China, Hong Kong, Singapore, and domiciles of convenience11 and meet certain size, liquidity, and float criteria as of the rebalancing reference date. 12 Eligible stocks are drawn only from the Global Industry Classification Standard® (GICS® ) sectors and industries, as detailed in Exhibit 10.
10 The S&P Total China + Hong Kong BMI Domestic Index is the combination of the S&P China A Domestic BMI, S&P China BMI, and S&P Hong Kong BMI. It covers China- and Hong Kong-domiciled companies listed globally that meet certain size and liquidity criteria.
11 Domiciles of convenience include the following: Bermuda, Channel Islands (as in British Channel), Gibraltar, Islands in the Caribbean (Anguilla, Antigua and Barbuda, Aruba, Bahamas, Barbados, British Virgin Islands, Cayman Islands, Curacao, Dominica, the Dominican Republic, Grenada, Haiti, Jamaica, Montserrat, Navassa Island, Puerto Rico, St. Barthlemy, St. Kitts and Nevis, St. Lucia, St. Martin, St. Vincent and Grenadines, Trinidad and Tobago, Turks and Caicos, the Virgin Islands), Isle of Man, Luxembourg, Liberia, and Panama.
12 Eligible stocks must have a float-adjusted market capitalization of at least USD 2.5 billion, a three-month average daily value traded no less than USD 8 million, and an Investable Weight Factor (IWF) of at least 15%.
Stocks that pass the index eligibility criteria are added to the index based on their float-adjusted market capitalization in descending order, up to a maximum of 300 constituents. Only one share class for each company is included in the index. If a company in the underlying index has multiple share classes, the priority for inclusion in the S&P New China Sectors Index is: 1) Hong Kong-listed shares, 2) U.S.-listed shares, 3) A-shares, and 4) Singapore-listed shares. The S&P New China Sectors Index is weighted by float-adjusted market capitalization, subject to a single stock weight cap of 10%, applied at each rebalancing. The index is reconstituted semiannually on the third Friday of June and December each year.
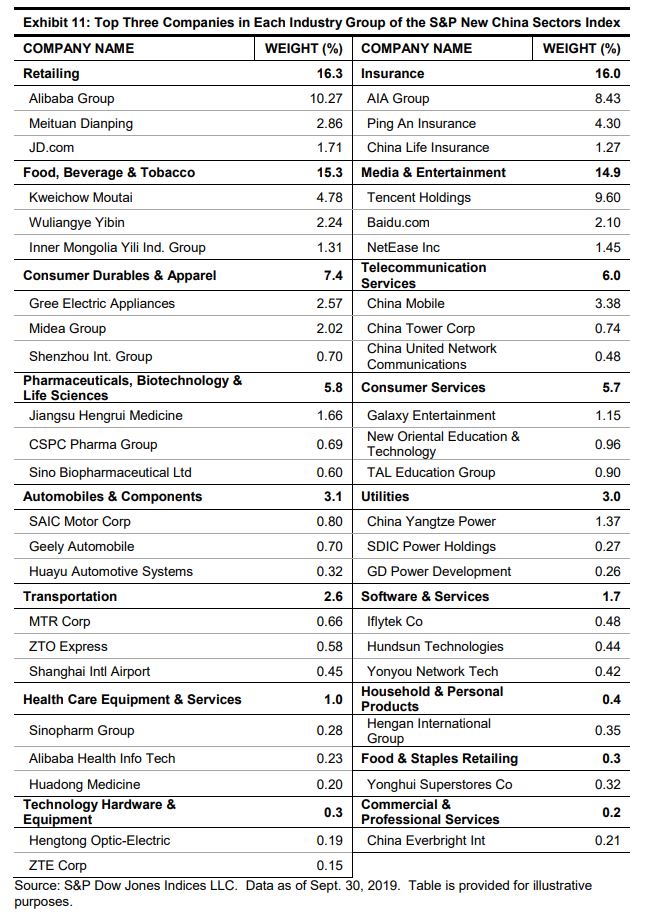
The S&P New China Sectors Index is designed to measure sectors and industries that are likely to benefit from China’s economic reforms, with a focus on Consumer Discretionary, Consumer Staples, Communication Services, Insurance, and Health Care. Many of the constituents are domestic or global leaders in their respective industries, such as China Mobile in Wireless Telecommunication Services, AIA Group and Ping An in Insurance, Alibaba, JD.com, Ctrip, and Vipshop in Internet & Direct Marketing Retail, Tencent, Baidu, NetEase in Interactive Media & Services, and MTR Corporation in Road & Rail. The S&P New China Sectors Index also includes consumer producers that offer wellknown brands, such as Moutai, Wuliangye, Yili, Mengniu, Want, Gree, ANTA, express delivery provider ZTO Express, education service provider New Oriental, as well as social media providers Momo, WEIBO, and YY that have brought revolutionary changes to people’s daily social life (see Exhibit 11).
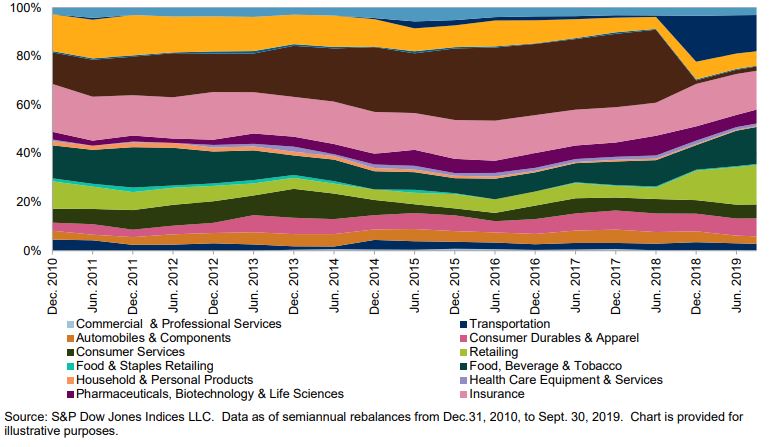
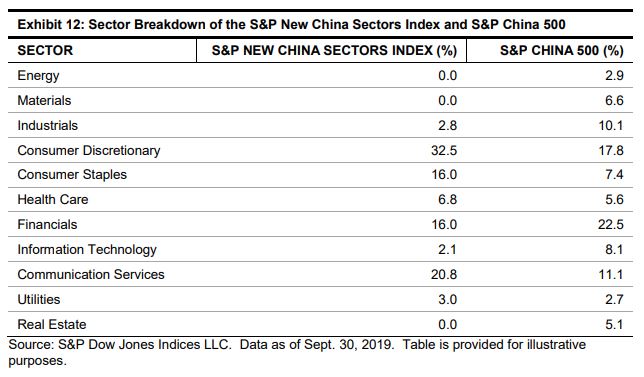
The S&P New China Sectors Index has historically held significantly higher weights in the consumer- and services-oriented sectors compared with the broad Chinese equities market, as represented by the S&P China 50013 (see Exhibits 12 and 13). At the GICS sector level, the Consumer Discretionary and Consumer Staples sectors, which comprised 17.8% and 7.4% in the S&P China 500, represented 32.5% and 16.0% of the S&P New China Sectors Index, respectively. The Communication Services sector, which had a weight of 20.8% in the S&P New China Sectors Index, was overweight by 9.7% compared with the S&P China 500. Industrials, Materials, and Financials were the most underweighted sectors in the S&P New China Sectors Index.
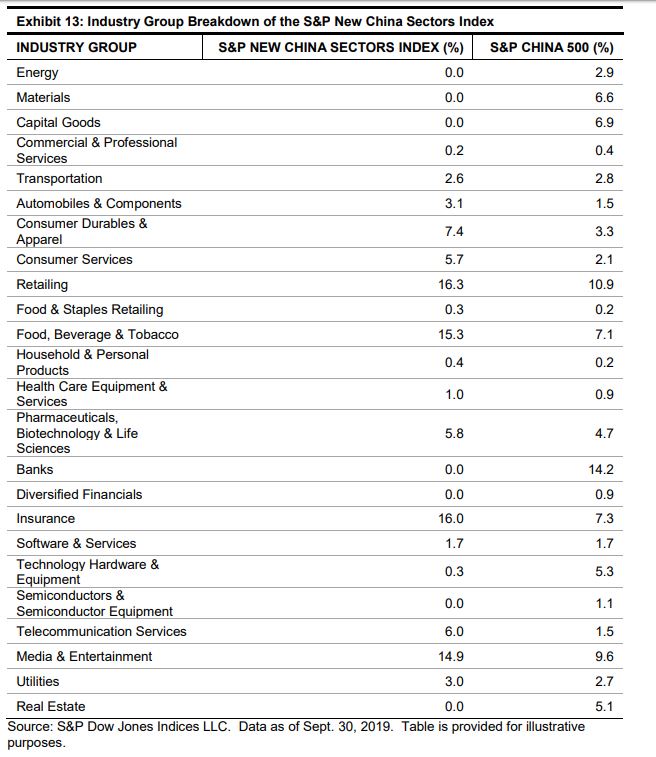
Looking deeper into the GICS industry group level, the most overweighted industry groups were Insurance, Food, Beverage & Tobacco, Retailing, and Media & Entertainment, which are expected to benefit from an increasing desire for a higher standard of living (see Exhibit 13 and Appendix 1).
13 The S&P China 500 comprises 500 of the largest, most liquid Chinese companies while approximating the sector composition of the broader Chinese equity market. All Chinese share classes including A-shares and offshore listings are eligible for inclusion.
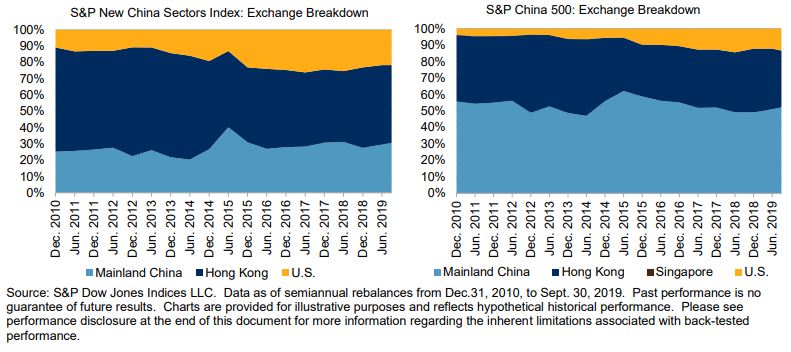
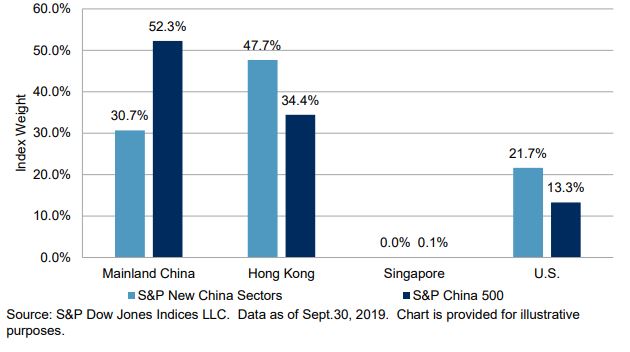
Because Hong Kong-listed shares are given higher preference among companies with multiple share types in the index construction, the S&P New China Sectors Index had higher weighting in Hong Kong-listed stocks than the S&P China 500 (see Exhibit 14 and Appendix 2).
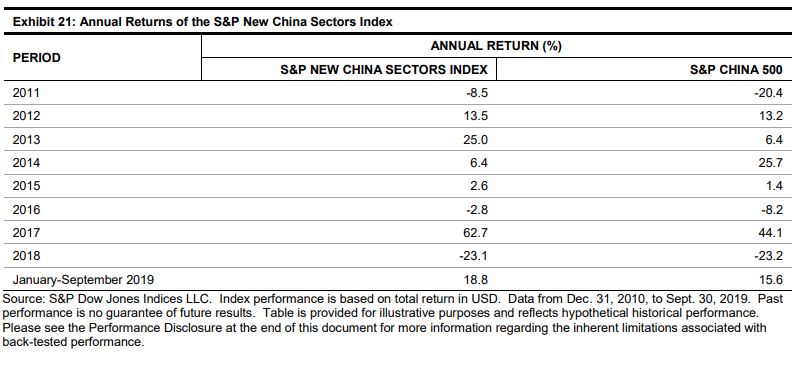
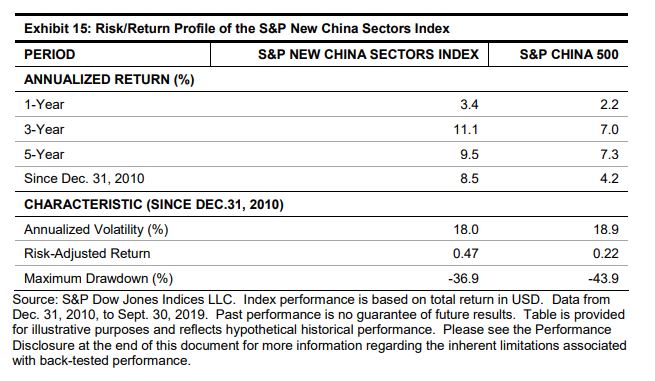
The new economy sectors performed differently than the broad equities market in China. To examine this discrepancy, we compared the performance of the S&P New China Sector Index and the S&P China 500. From Dec. 31, 2010, to Sept. 30, 2019, the S&P New China Sectors Index recorded an annualized return of 8.5%, outperforming the S&P China 500 by 4.3% per year, indicating that the new economy sectors performed better than the broad equities market (see Exhibit 15). The S&P New China Sectors Index had a smaller return drawdown than the S&P China 500 and the highest risk-adjusted return over the long term.
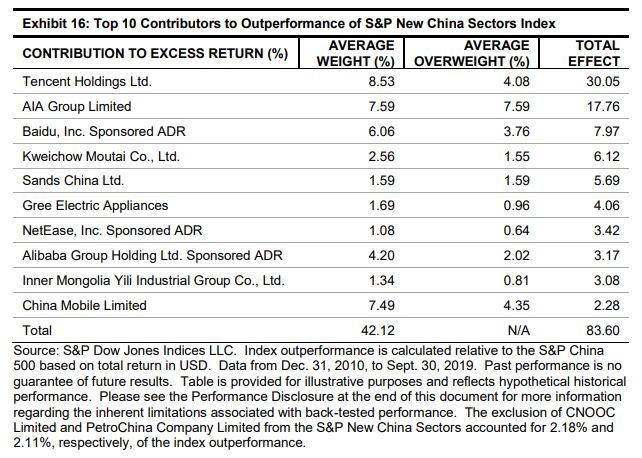
Over the period from Dec. 31, 2010, to Sept. 30, 2019, the top 10 contributors to the outperformance of the S&P New China Sectors Index were the key players from the Communication Services (Tencent, Baidu, NetEase, China Mobile), Financials (AIA Group), Consumer Discretionary (Sands China, Gree Electric Appliances, Alibaba Group Holding Ltd.), and Consumer Staples (Kweichow Moutai, Inner Mongolia Yili Industrial Group) sectors, accounting for 83.6% of the total index outperformance (see Exhibit 16).
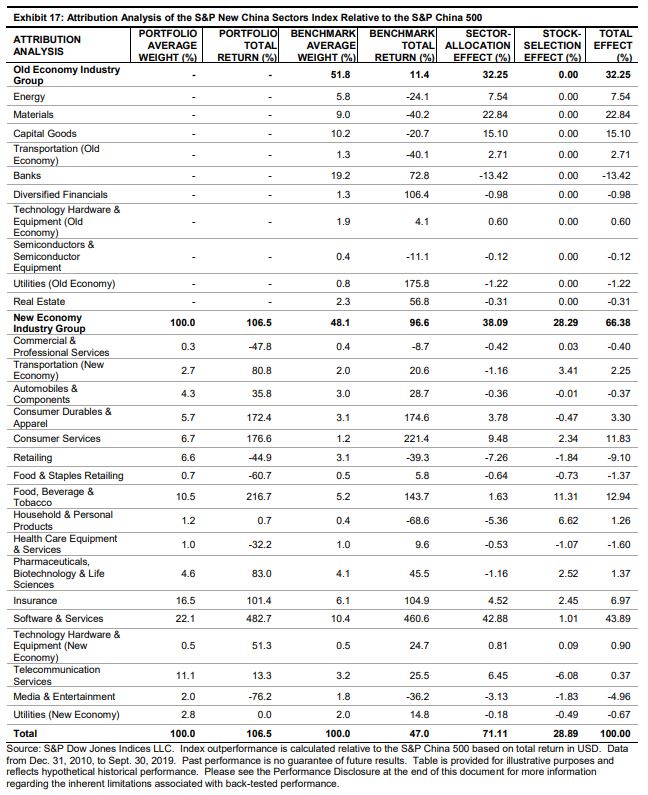
The majority of the outperformance of the S&P New China Sectors Index was from sector allocation effects, with overweights in Software & Services, Consumer Services, Telecommunication Services, and Insurance, and underweights in Materials, Capital Goods, and Energy, as compared with the S&P China 500 (see Exhibit 17). On the other hand, the underweight of Banks and the overweight of Retailing had a negative impact on the performance of the S&P New China Sectors Index. Collectively, the allocation bias (overweight) in the new economy sectors accounted for 38.1% of the outperformance of the S&P New China Sectors Index versus the S&P China 500, while the underweight in the old economy sectors attributed to 32.3%.
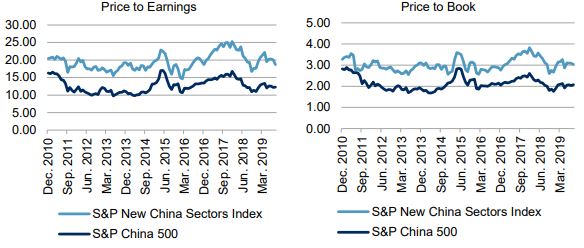
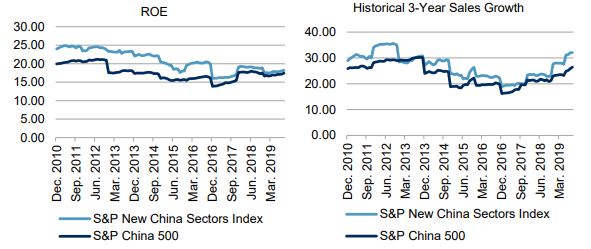
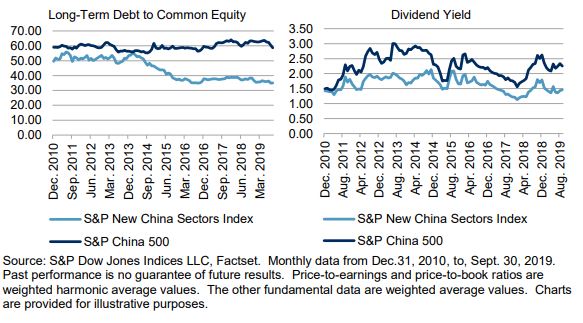
Companies in the new economy sectors featured higher revenue growth, higher profitability, and lower leverage than the broader equities market, and they tended to be priced with higher valuation (P/E and P/B) and lower dividend yield (see Exhibit 18).
To support more sustainable economic growth, the Chinese government is transforming from an investment- and manufacturing-driven market to a consumption- and services-driven economy. Consumer Discretionary, Consumer Staples, Communication Services, Health Care, Insurance, and Independent Power and Renewable Electricity Producers are the main sectors and industries benefiting from this policy shift. As China’s economic structural reforms deepen, the demand for benchmarks tracking sector drivers for China’s new economy is increasing. The S&P New China Sectors Index is designed to provide equity exposure to sectors and industries likely to benefit from China’s economic reforms, with a focus especially on Consumer Discretionary, Consumer Staples, Communication Services, Insurance, and Health Care. The S&P New China Sectors Index had its biggest overweights in the Consumer Discretionary, Communication Services, and Consumer Staples sectors, while the most underweight are the Industrials, Materials, and Financials sectors, as compared with the S&P China 500 index. These sector biases resulted in significant fundamental and performance differences between the S&P China 500 and the S&P New Sectors Index. From Dec.31, 2010, to Sept. 30, 2019, the S&P New China Sectors Index achieved an annualized return of 8.5%, outperforming the S&P China 500 by 4.3% per year, indicating the new economy sectors performed better than the broad equities market. The S&P New China Sectors Index had a smaller return drawdown than the S&P China 500 and a higher riskadjusted return over the long term. The outperformance of the S&P New China Sectors Index was dominated by sector allocation effects. Collectively, the allocation bias (overweight) in the new economy sectors accounted for 38.1% of outperformance of the S&P New China Sectors Index versus the S&P China 500, while the underweight in the old economy sector stocks contributed 32.3% of it. Companies in the new economy sectors featured higher revenue growth, higher profitability, and lower leverage than the broader equities market, and they tended to be priced with higher valuation and lower dividend yield.
