S&P Global Offerings
Featured Topics
Featured Products
Events
S&P Global Offerings
Featured Topics
Featured Products
Events
S&P Global Offerings
Featured Topics
Featured Products
Events
Featured Products
Ratings & Benchmarks
By Topic
Market Insights
About S&P Global
Corporate Responsibility
Culture & Engagement
Investor Relations
Featured Products
Ratings & Benchmarks
By Topic
Market Insights
About S&P Global
Corporate Responsibility
Culture & Engagement
Investor Relations
S&P Global Offerings
Featured Topics
Featured Products
Events
Language

Editor’s note: This article is based on a presentation delivered at the 2019 World Economic Forum meeting in Davos, Switzerland by S&P Global Chief Executive Officer Doug Peterson and President of S&P Global Market Intelligence Martina Cheung.
Published: January 20, 2019
Highlights
Increasing women’s labor force participation could add hundreds of billions of dollars to the global economy—and trillions of dollars to equity markets.
In the United States, a modest increase in women in the workforce could add $511 billion to GDP over the next ten years. Similar increases are possible in most developed economies.
The additional growth projected from increasing women’s labor participation translates into trillions of dollars in “extra” equity market value. The U.S., for example, could contribute an additional $4.5 trillion in market value over the next decade.
As clouds begin to gather on what has been a sunny horizon for the global economy, a significant underutilized resource could help fuel global GDP growth and pump new life into equity markets: women.
In the simplest terms, the need to engage more women in the workforce, to empower them from an economic perspective, and to forge greater gender parity across all aspects of life is of paramount importance to economies both developed and emerging.
Moreover, the benefits extend beyond national borders. In fact, S&P Global research demonstrates that increased women’s labor force participation in one country can have a ripple effects that reach around the world—demonstrating the true interconnectedness of individual economies.
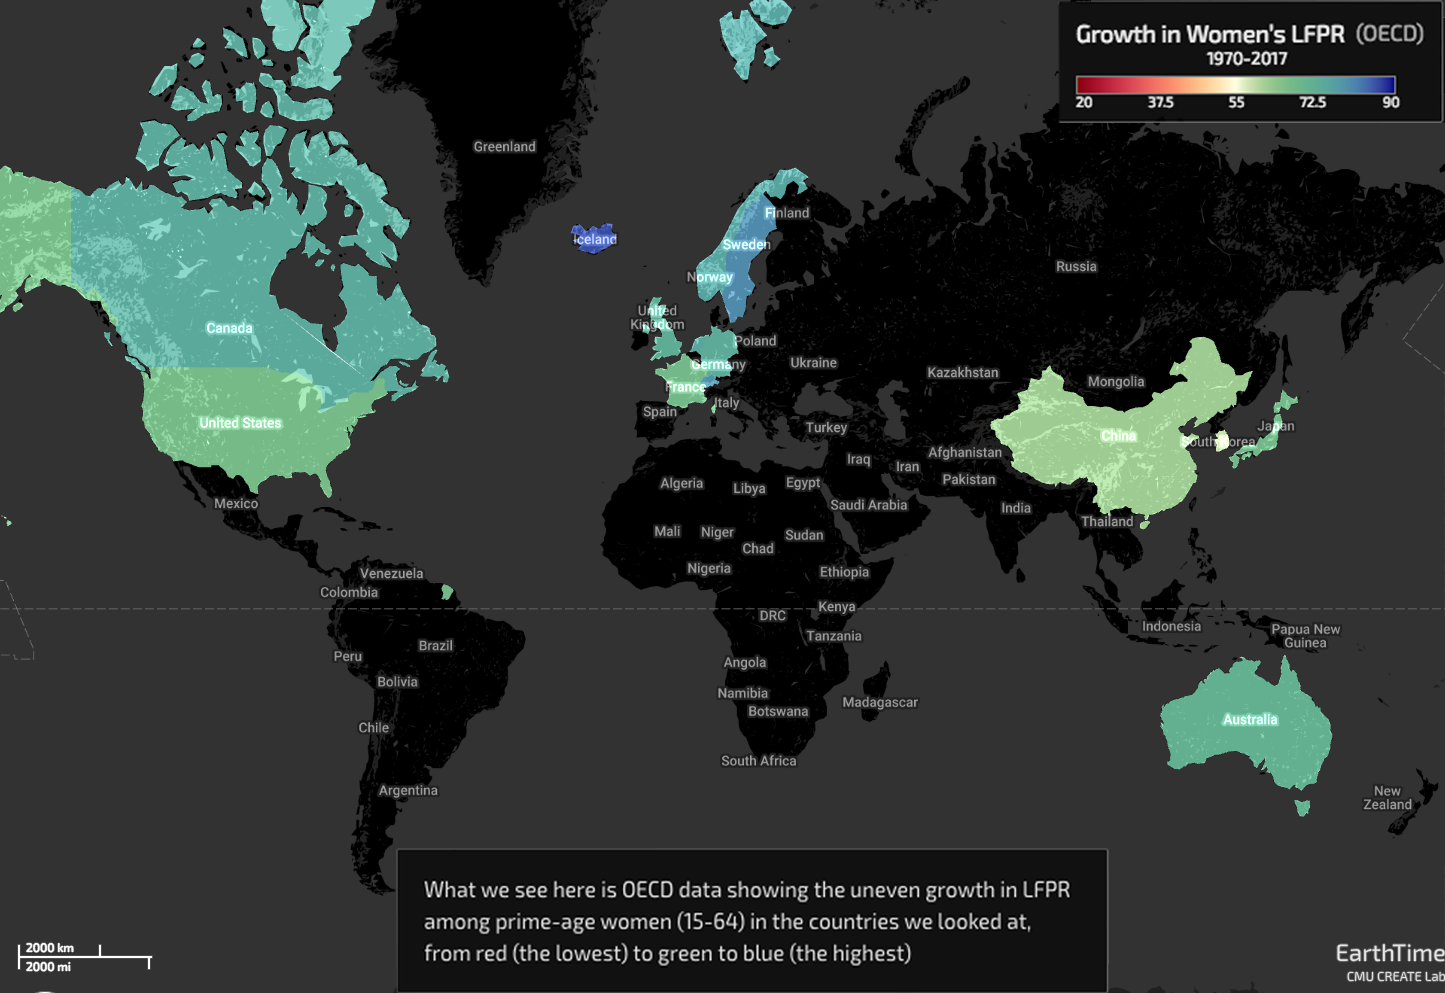
In the past half century, the labor-force participation rate (LFPR) among prime-age women (15-64) has ebbed and flowed at disparate rates around the world (see Illustration 1).
Illustration 1
Source: OECD
Among OECD members, some of the standard-bearers for growth in women’s LFPR are Sweden, which has gone from roughly 59% of prime-age women working to more than 80% last year; Norway, where fewer than half of women worked outside the home 50 years ago and now 75% do so; and the Netherlands, where only 1-in-3 women were in the labor force in the early 1970s, and now more than three-in-four are (see Illustration 2).
Illustration 2
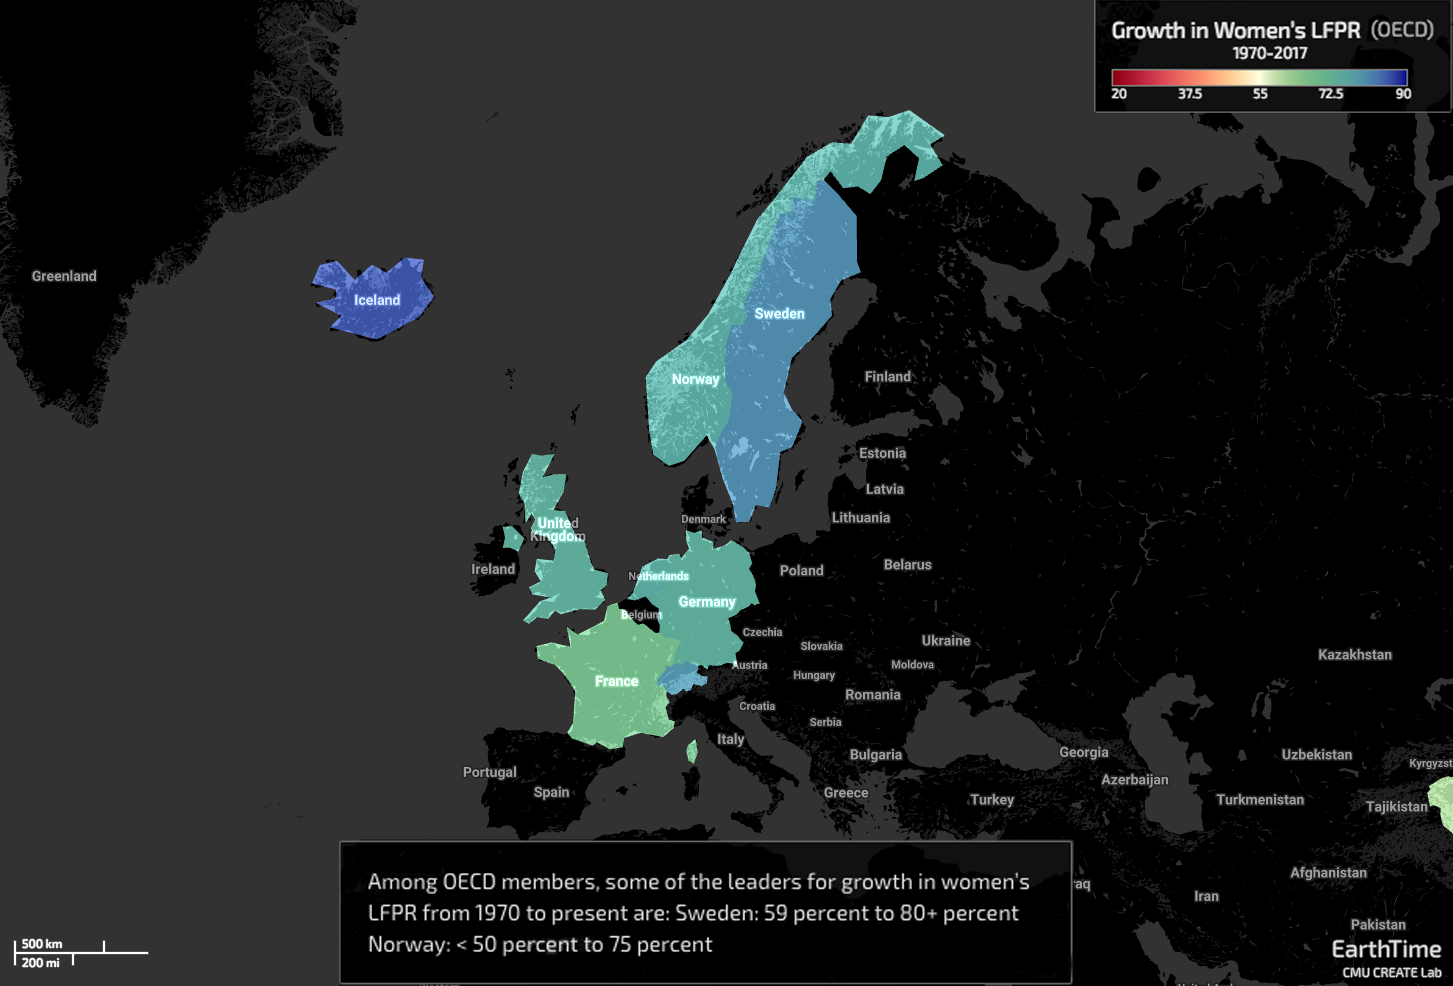
To be fair, Iceland boasts the highest prime-age women’s LFPR among countries we looked at, at 85.7%—but the numbers only go back to 1991, when a still-remarkable 77% of Icelandic women were in the work force.
A Missing $1.6 Trillion In GDP
In late 2017, S&P Global economists conducted a scenario analysis of the U.S., where in 1990 the prime-age female labor participation rate was close to the top of the 22 advanced OECD economies—a figure that had slipped to 20th in 2016.
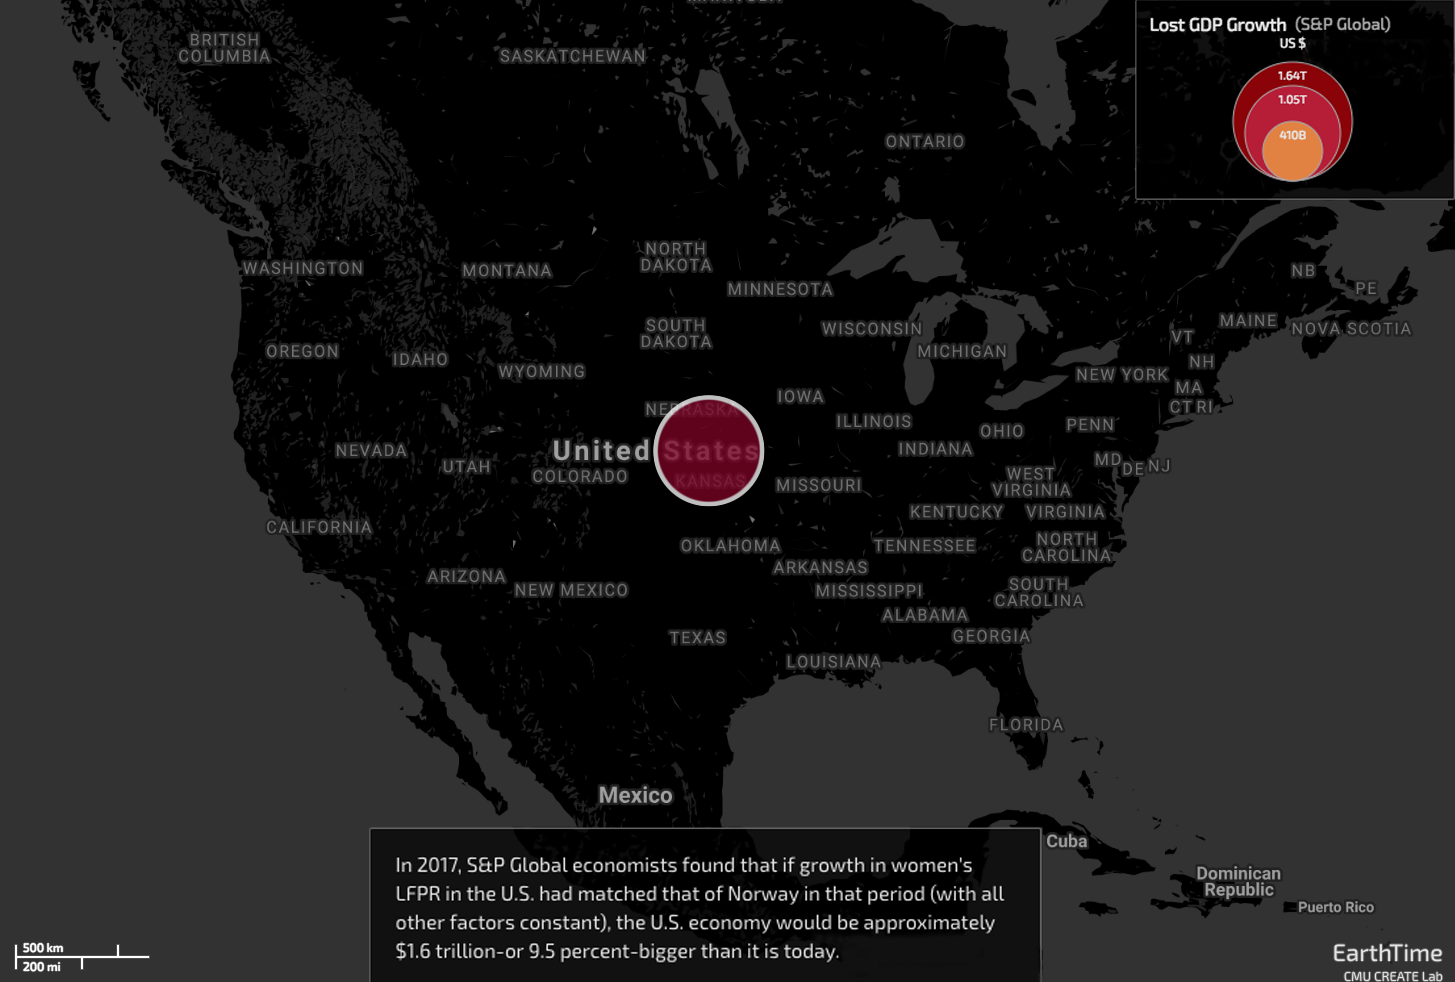
Specifically, we wondered what would have happened to the U.S. economy had female LFPR kept pace with Norway—a baseline we used because the number of women working outside the home in those two countries more or less matched in the early 1970s. However, growth in LFPR among Norwegian women significantly outpaced that among American women for the next few decades, with the rate among all U.S. adult women peaking at 60.3% in March 2000.
If the growth in women’s LFPR in the U.S. had matched that of Norway from 1970-2016 (with all other factors constant), the U.S. economy would be approximately $1.6 trillion bigger than it is today (see Illustration 3). That’s an extra $5,000 or so for every man, woman, and child in the country. This represents an incredible opportunity for responsible growth, one built on a foundation of inclusivity.
Illustration 3
Similarly striking data can be seen in a number of other countries we looked at. Among those with LFPR data going back to 1970 are Germany, France, and Japan.
Our analysis showed that Germany’s $3.7 trillion economy—the world’s fourth-largest—would be $406 trillion bigger than it is today if women’s LFPR had grown to match that of Norway. That’s an 11% difference.
France’s economy—the world’s seventh-largest at $2.6 trillion—would be $490 billion, or 16%, larger than it is today.
And in Japan, the world’s third-largest national economy with GDP of approximately $6.7 trillion, the extra growth from increased women’s LFPR would have totaled $934 billion. That’s an extra 14%.
So, let’s now make an apples-to-apples comparison using a common starting point—1991—which is the furthest back that we have labor-force data for all 10 countries we looked at (see Illustration 4).
Illustration 4
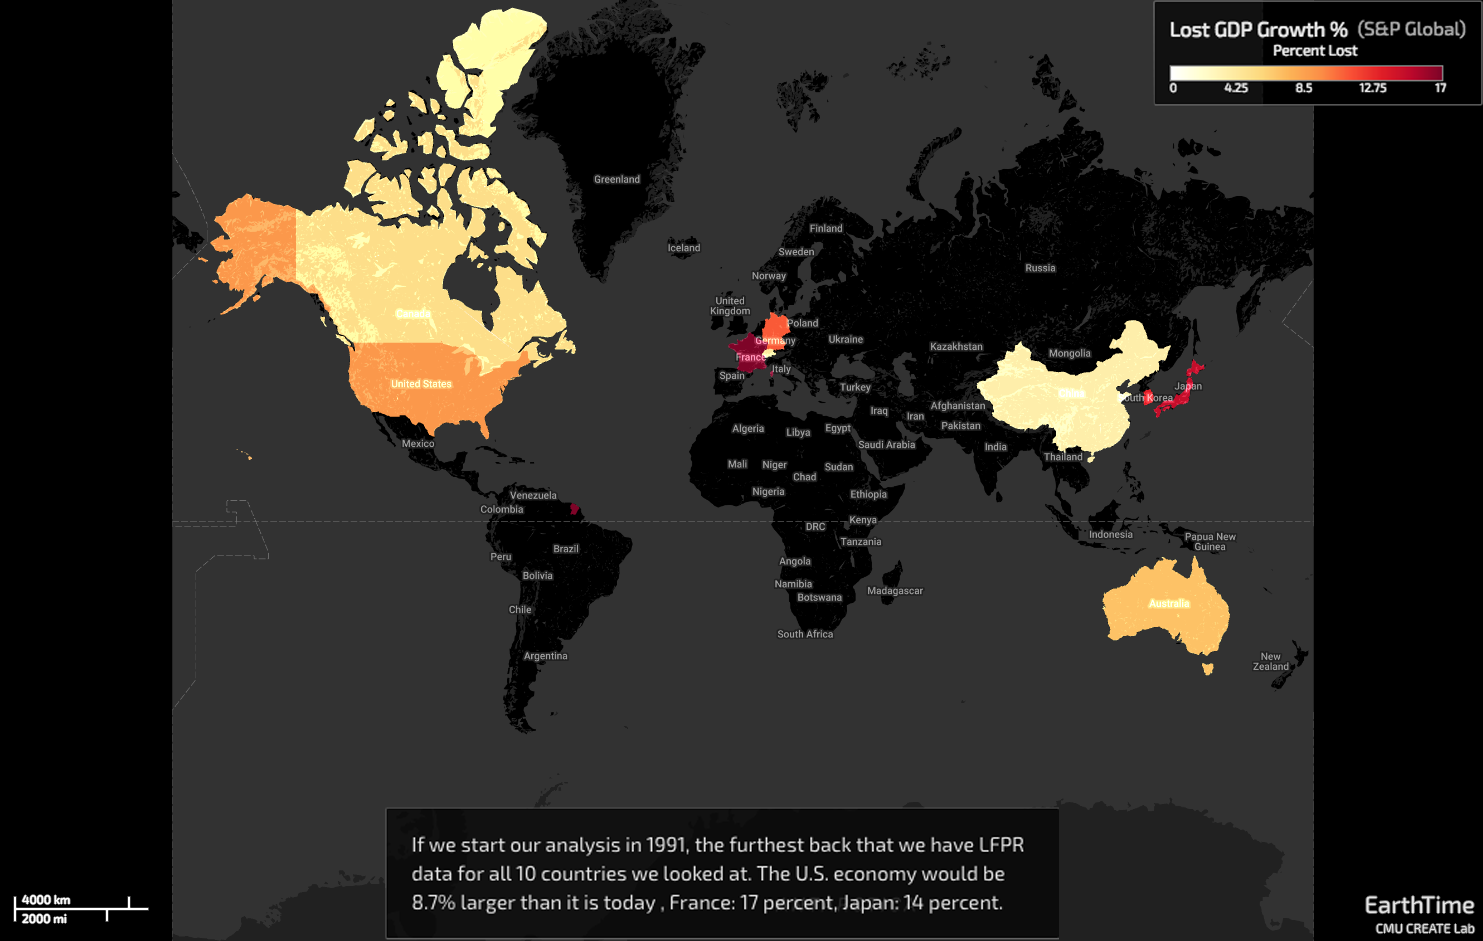
If the growth in women’s LFPR in the U.S. had matched that of Norway from 1991-2017, the U.S. economy would be approximately $1.5 trillion, or 8.7%, bigger than it is today. Canada’s economy would be 5% larger.
For the European countries we looked at, the numbers are even starker.
While Switzerland’s economy would be just 4% bigger, the U.K.’s would be 8% larger. Germany missed out on an extra 10.8% in GDP growth, and France’s economy would be a staggering 16.7% bigger than it is today.
A similar story can be seen in the Asia-Pacific region.
While Australia’s economy would be “just” 6.6% larger, South Korea missed out on an extra 13% of GDP growth, and Japan a remarkable 14.4%.
Which leads us to our outlier: China, whose economy would be just 3.5% bigger than it is today—in large part because the number of women in the country’s labor force in 1991 was comparatively high.
Now, however, China’s numbers on women’s labor-force participation are trending in the wrong direction. Where overall women’s LFPR once exceeded 70%—higher than our standard-bearer, Norway—the number had fallen to just 61% last year.
To be sure, female labor force participation in China was historically high under the Communist model, when women were, in the words of Mao Zedong, meant to “hold up half of the sky.” But labor-force participation has been falling for both men and women during the reform period, with the rate for women falling faster than that for men. This is almost fully explained in both genders by the sharp drop among workers aged 15-24. As China has become richer and more developed (and child-bearing has been delayed), women in particular are staying in school longer. But note that this has recently leveled out.
Either way, declining female labor-force participation could have huge ramifications for a government looking to sustain what has been incredibly impressive economic growth for an extended period.
A Decade Of Opportunity
So let’s focus our analysis forward to see just how much economies stand to gain with increased women’s LFPR. Starting with the world’s biggest economy, an increase in U.S. women’s participation to that of our standard-bearer would, in the next decade, add a cumulative $511 billion in output above S&P Global economists’ baseline forecast (see Illustration 5).
Illustration 5
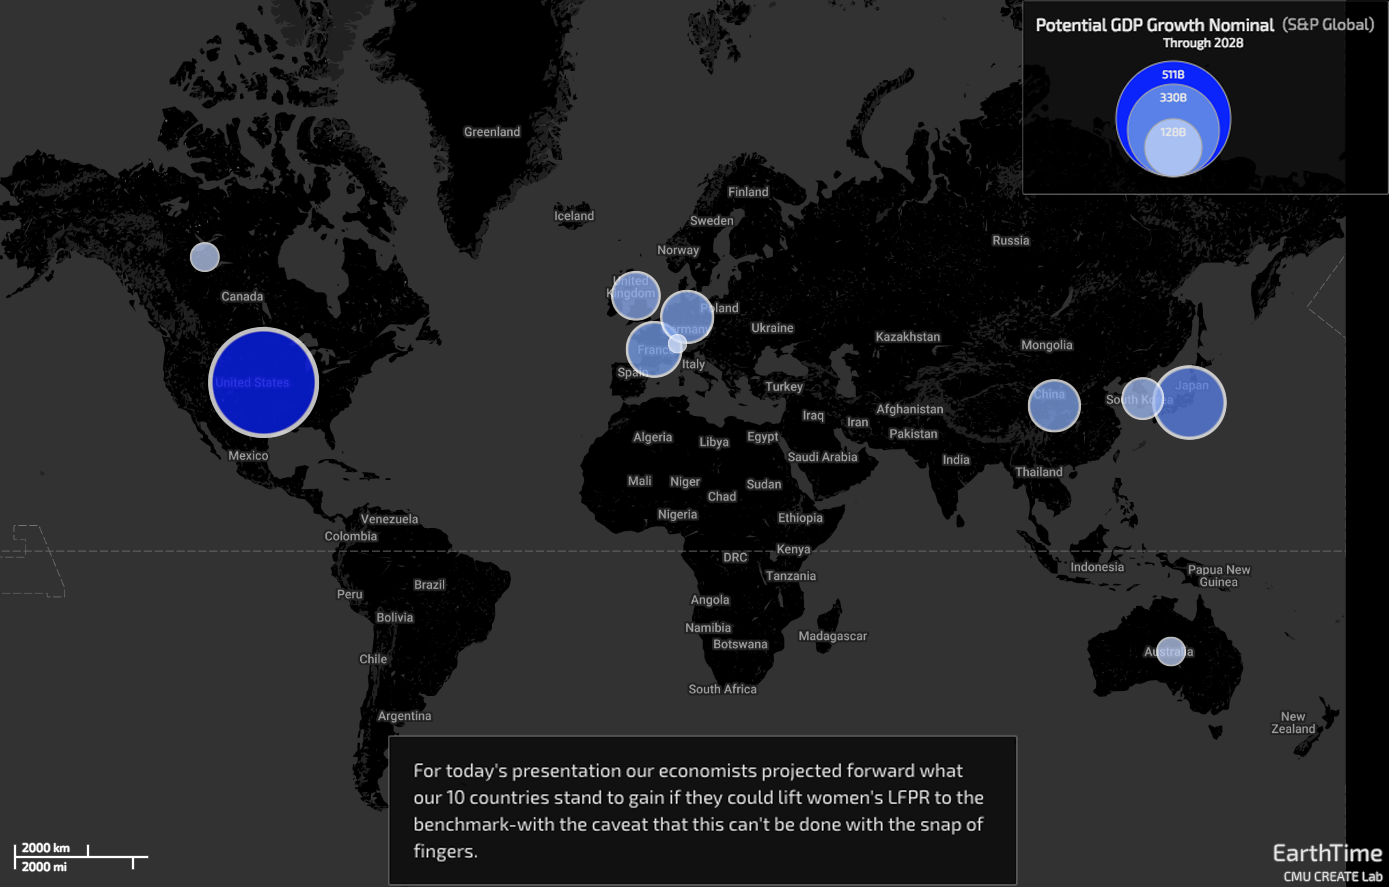
Even with U.S. GDP approaching $20 trillion, an extra few hundred billion dollars can go a long way.
Looking down the list of our countries, we see similarly inspiring results.
Bearing in mind that labor-force participation among Canadian women is comparatively high, as we saw earlier, an increase would still add $35 billion to the country’s GDP by 2028.
France would enjoy an outsize gain: Increasing women’s LFPR would add almost $132 billion to the country’s $2.8 trillion economy.
Germany would boast an extra $120 billion in GDP, the U.K. would add an extra $100 billion, and Switzerland—again, with comparatively high women’s LFPR—would see an added $14 billion in economic output.
In Japan, increased women’s LFPR would add more than $228 billion to GDP in a decade. With the Japanese economy at roughly $6.7 trillion, that’s a tremendous gain.
Australia can expect an extra $34 billion in output, and South Korea, with a $1.3 trillion economy that ranks 11th in the world, would add almost $74 billion. In other words, an economy that in our baseline forecast is set to reach $1.73 trillion by 2028 could instead grow to almost $1.81 trillion.
Which brings us back to China, where S&P Global Ratings forecasts a moderation in economic growth this year—albeit to a still-robust 6.2%. Our calculation shows that the roughly $12 trillion Chinese economy would grow by an extra $115 billion in the next decade if the country could find a way to reverse the decline in women’s LFPR and bring it to parity with the OECD leaders in that category.
While the U.S. stands to gain the most in dollar terms—because of the sheer size of the American economy, the rank order changes when we look at the potential gains in percentage terms (see Illustration 6).
Illustration 6
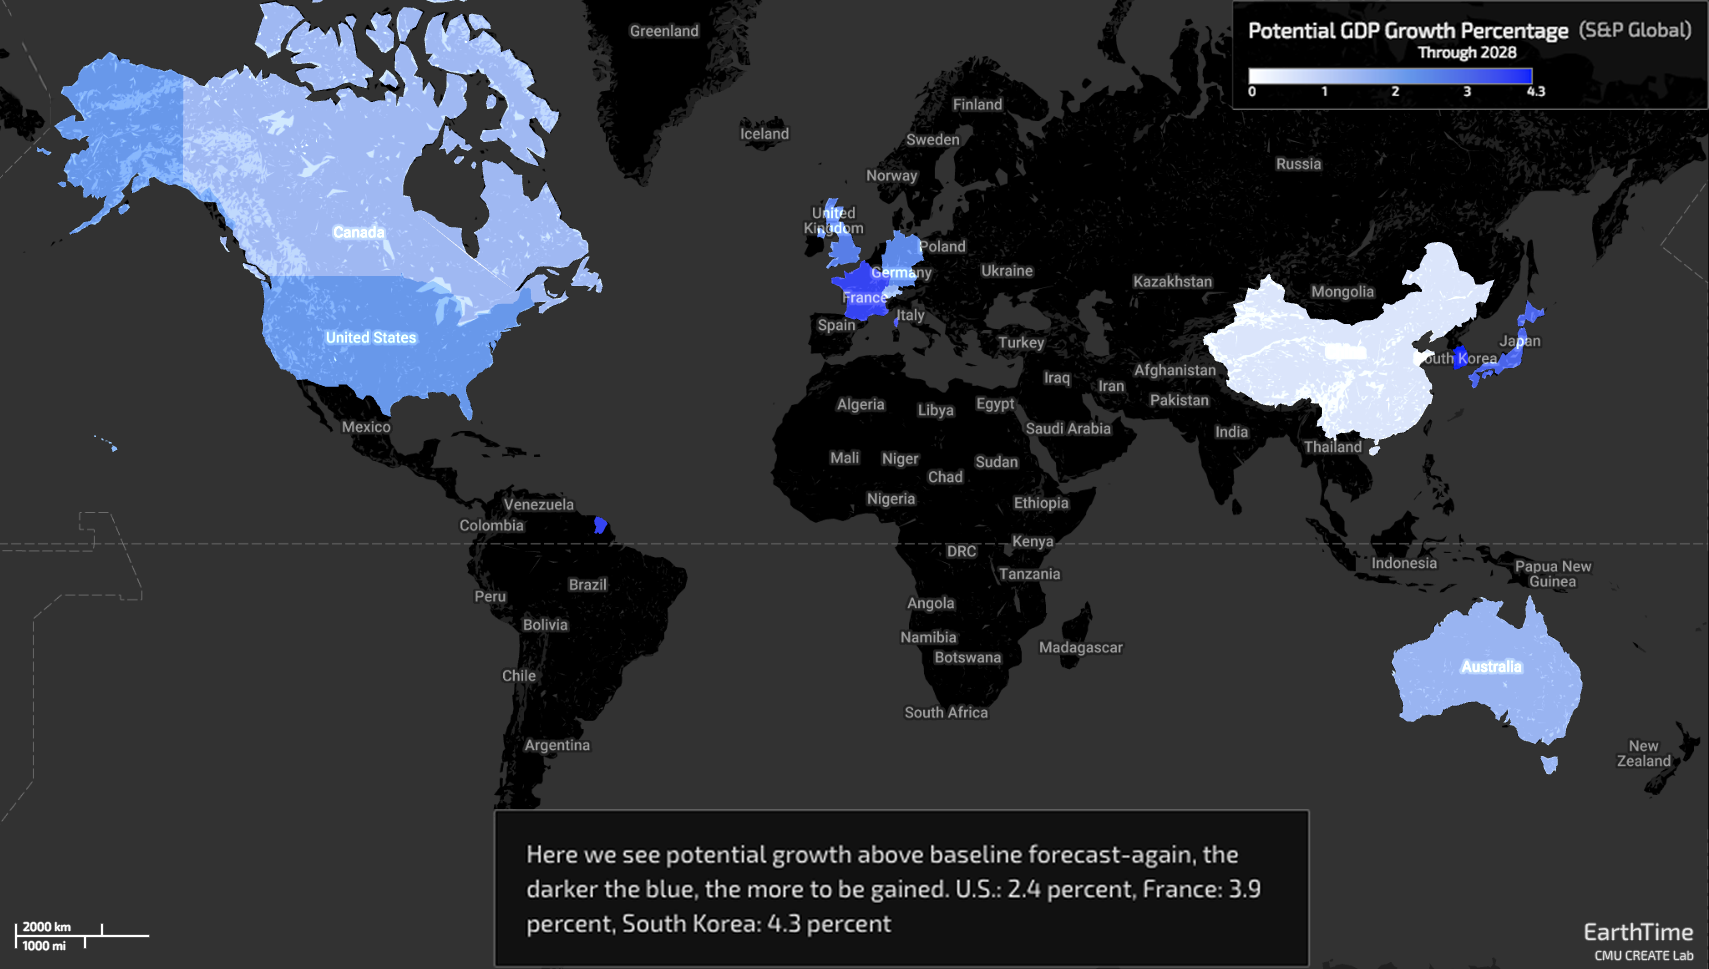
Here, we see that by 2028 South Korea’s economy could grow an additional 4.3%, enhanced by increased women’s LFPR. Japan could enjoy an additional 3.4% in GDP, China 0.6%, and Australia an “extra” 1.7%.
Among European countries, France would benefit the most, potentially adding 3.9%, the U.K. 2.9%, Germany 2.7%, and Switzerland—where, again, women’s LFPR is already comparatively high—1.8%.
The U.S. economy could gain an additional 2.4%, and Canada an extra 1.6%.
Overcoming The Hurdles To Gender Parity
Clearly, there are a number of hurdles to reaching economic gender parity—from policy shortcomings to societal attitudes to familial obligations.
For example, a 2013 Pew Research survey found that 39% of mothers in the U.S. had, at some point in their careers, taken off a significant amount of time to care for a child or other family member—and more than 25% of mothers had quit work entirely to do so. Meanwhile, just 24% of fathers had taken significant time off to assume these responsibilities.
Similarly, a 2018 report from the U.N.’s International Labour Organization detailed time-use data in 64 countries (representing two-thirds of the world’s working-age population) and found that women perform more than three-fourths of the 16.4 billion hours spent in unpaid care work every day. It went on to note that in no country in the world do men and women provide an equal share of unpaid care work, with women providing more than three times as much as men.
From an economic standpoint, the value of women’s unpaid care work represents 6.6% of global GDP, or $8 trillion; men’s contribution accounts for 2.4% of global GDP, or $3 trillion.
To be sure, men’s unpaid care work has increased in many countries in recent decades. But the ILO found that from 1997-2012, the gender gap in time spent on unpaid care narrowed by just seven minutes, to 1 hour and 42 minutes, in the 23 countries with available data. At that pace, it would take 210 years to close that gap in these countries.
Often, when we say that “familial obligations” fall primarily on women, what comes to mind is child-rearing. But a good portion of this care is for family members of previous generation—aging parents, grandparents, aunts and uncles.
S&P Global Ratings’ most recent study on global aging, in 2016, was eye-opening in a number of ways. For obvious reasons, we approached it from the standpoint of sovereign credit quality and the need for countries to explore structural changes to their social safety nets in an effort bolster their prospects for long-term fiscal sustainability. But the data—specifically the numbers on old-age dependency—are useful for this dialogue, as well.
According to figures from Eurostat and the United Nations, as of 2015, the old-age dependency ratio, or OADR—that is, the number of people 65 and older relative to the population aged 15-64—will double by 2050 in most countries (see Illustration 7).
Illustration 7
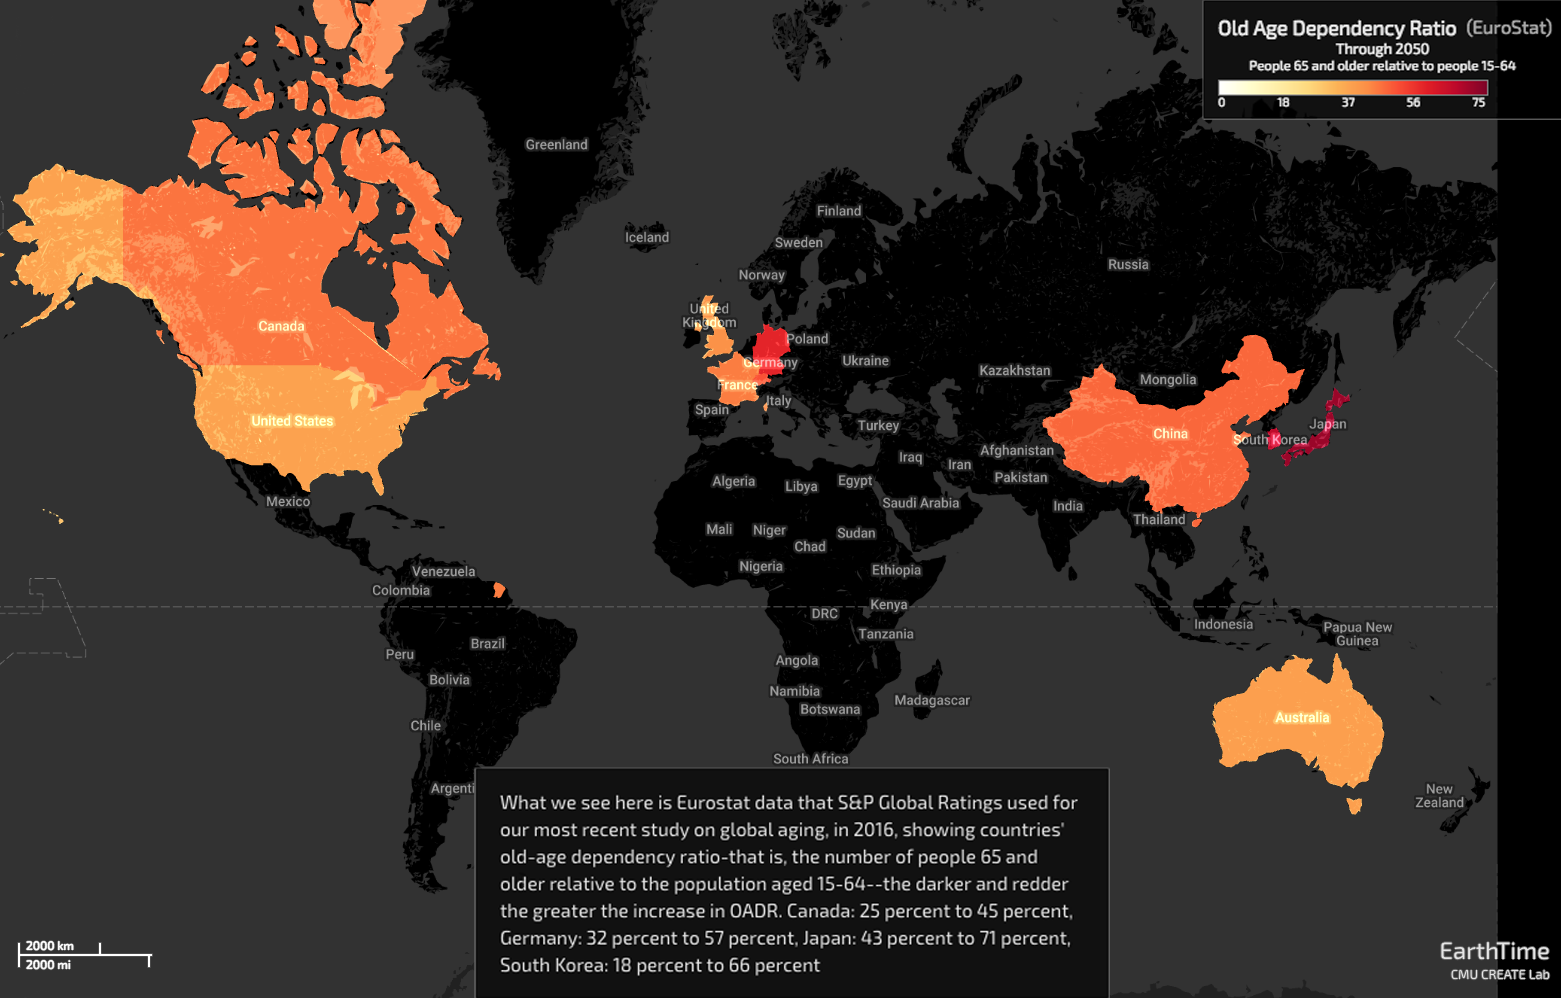
Source: Eurostat
For our 10 countries, the figures are striking.
In the U.S., for example, as the population goes from roughly 325 million to 389 million in 2050, the old-age dependency ratio will rise much faster, approaching 37% from around 22% now.
In Canada, the OADR will jump from around 25% now to almost 45%.
Similarly, the old-age dependency ratio in the U.K. will exceed 40%, in France, it will go from around 28% now to almost 44%, Switzerland’s will approach 50%, and Germany’s will surge to more than 57%.
And here’s where the numbers really start to take off.
In Korea, the OADR will go from just the high-teens today to almost 66%. In Japan, already among the grayest countries in the world, the number of people 65 and older relative to those younger will be almost 71% by 2050.
Here, it’s important to remind ourselves that populations aren’t simply nameless, faceless statistics—they’re people. And, as we saw in the previous data set, the care that these aging family members will require will fall disproportionately on the shoulders of women—many of whom will simply drop out of the labor force for extended periods, absent a concerted effort to keep them.
Clearly, policy can be an effective tool in narrowing the gender-parity gap. In fact, a prime example can be seen in the differing trends in women’s labor-force participation in Japan and the U.S.
Much of this contrast is a result of progress in the former, where for decades women’s LFPR showed a pronounced M-shaped pattern, with high participation just after degree attainment, followed by a dip during traditional marriage and early child-rearing years, then a rebound as children matured.
But a 2017 study by the Brookings Institution found that women in Japan have increasingly broken from this pattern, with every female cohort born after the 1952–56 group showing a successively smaller early-career decline in labor-force participation. In fact, women born after 1977 have maintained or increased their participation through their 20s, with relatively muted declines in their early 30s.
Since Prime Minister Shinzo Abe took office in 2012, Japan’s female LFPR has ticked up, to 69.4%—and now exceeds the rate among American women, at 67.9%.
While it’s difficult to draw a direct line from policy to progress, it seems likely that Mr. Abe’s “womenomics” initiatives, under which the Japanese government has incentivized companies to promote women’s labor-force participation, have worked.
In contrast to the U.S.—the only OECD country that doesn’t provide income support during maternity or parental leave by law—Japan continues to improve conditions for parents who work.
In 1969, the Japanese government guaranteed 12 weeks of paid maternity leave; reforms in the mid-1990s expanded this to one year of paid leave for both parents. By 2014, Mr. Abe’s administration had enacted reforms providing for two-thirds of a worker’s earnings to be replaced during the first six months of leave. Equally important, it increased government daycare capacity by 219,000 spots.
It seems clear that initiatives such as Mr. Abe’s “womenomics” are a step in the right direction for the promotion of gender parity—and that increased economic empowerment among women will be a boon to global growth.
Fueling Global Equity Markets
Nowhere is this reflected more, perhaps, than in the financial markets—and here’s where S&P Global’s analysis takes another interesting turn.
Based on the so-called up-market capture ratio, which measures the historical sensitivity of stock markets to economic expansion, even a small amount of additional GDP growth can have an outsize positive effect on benchmark equity indices in the 10 countries we looked at.
For example, the up-market capture ratio, or UMCR, in the U.S. is 3.6%. That means that every 1 percentage point of economic expansion in the U.S. historically translates to 3.6% of growth in the benchmark equity index—in this case the S&P U.S. Broad Market Index (see Illustration 8).
Illustration 8
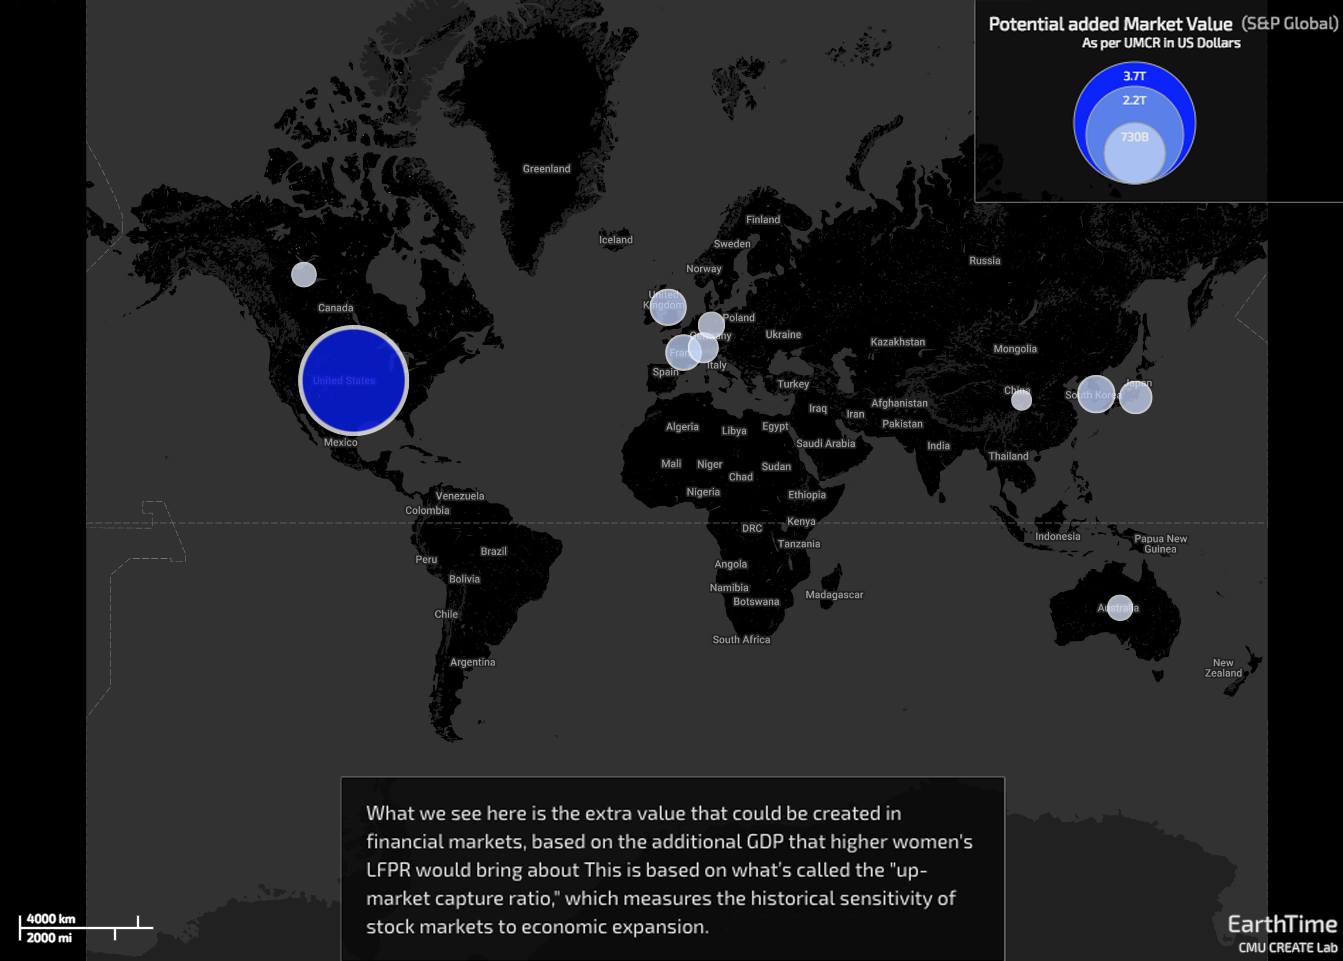
And we know that the U.S. economy would benefit greatly from increased women’s labor participation. So, if we factor in that additional growth, the market value of companies in the U.S. BMI would increase an “extra” $3.7 trillion in a decade.
While we see varied results across the countries we looked at, a few are worth noting as particularly positive.
France, with a historical up-market capture ratio of 3.1%, would see an additional $227 billion in market value in a scenario where increased women’s labor participation added to economic growth.
Switzerland, with a UMCR of 3.9% to its own growth, would see the market value in the benchmark S&P Switzerland BMI grow an additional $134 billion.
And South Korea is once again a standout. Given the country’s historical domestic UMCR of 3.7%, the additional growth that would come from increased women’s LFPR would add an extra $261 billion to equity market capitalization in the next 10 years.
And these are just the effects that each country would have on itself.
More remarkable are the results we find when we assess how countries’ economic growth reverberates around the world. Here, we’ll see just how individual countries’ stock markets are influenced by each other’s growth.
Cross-Border Benefits
Let’s look at the relationship between Canada and South Korea, two countries on opposite sides of the globe and a fairly run-of-the-mill trade link (with South Korea exporting roughly $6 billion of goods to Canada each year, making it Canada’s seventh-largest trade partner).
While Canada’s up-market capture ratio is 2.4% to its own growth—again, for every percentage point of Canadian GDP growth, Canada’s equity market returns 2.4%—that same percentage point of Canadian economic growth translates to a 6.9% return in South Korea.
In other words, the fate of South Korea’s equity market is, by one measure, almost twice as sensitive to growth in Canada as it is to economic expansion at home.
When we add in the “extra” GDP growth that Canada would enjoy with higher women’s labor force participation, then South Korea’s market cap could rise an additional $217 billion.
Much of the variation in stock-market sensitivities can be explained by the amount of trade a country conducts with a particular partner relative to the size of its trade surplus (or deficit) and annual output, its exports as a percentage of GDP, and where a country ranks in total market capitalization.
Of the 10 countries we looked at, South Korea is the most sensitive to economic expansion both at home and outside its borders. Its up-market capture ratio relative to U.S. growth is 8.4%; its UMCR to Japanese GDP gains is 8.5%; and its sensitivity to economic expansion in France is a whopping 10.2% (see Illustration 9).
Illustration 9
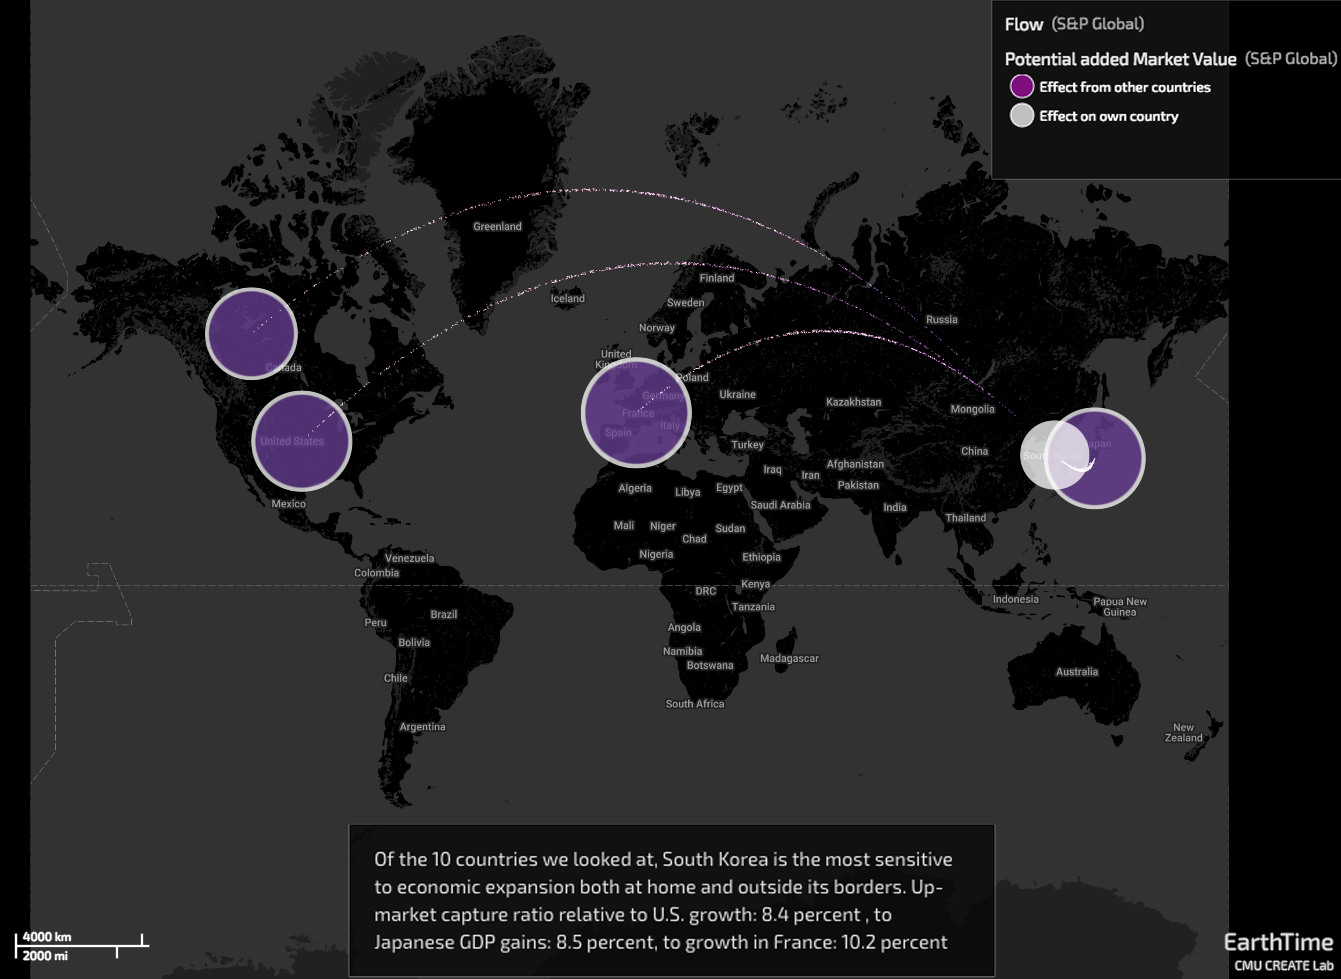
Equities in China, too, are notably sensitive to growth in other countries. With an up-market capture ratio to its own growth of just 1.6%, its sensitivity to U.S. growth is 5.5%; to U.K. growth, 6.1%; and to Japanese growth, an astounding 12.7%—more than eight times the sensitivity to its own growth, and the highest UMCR we found in our analysis.
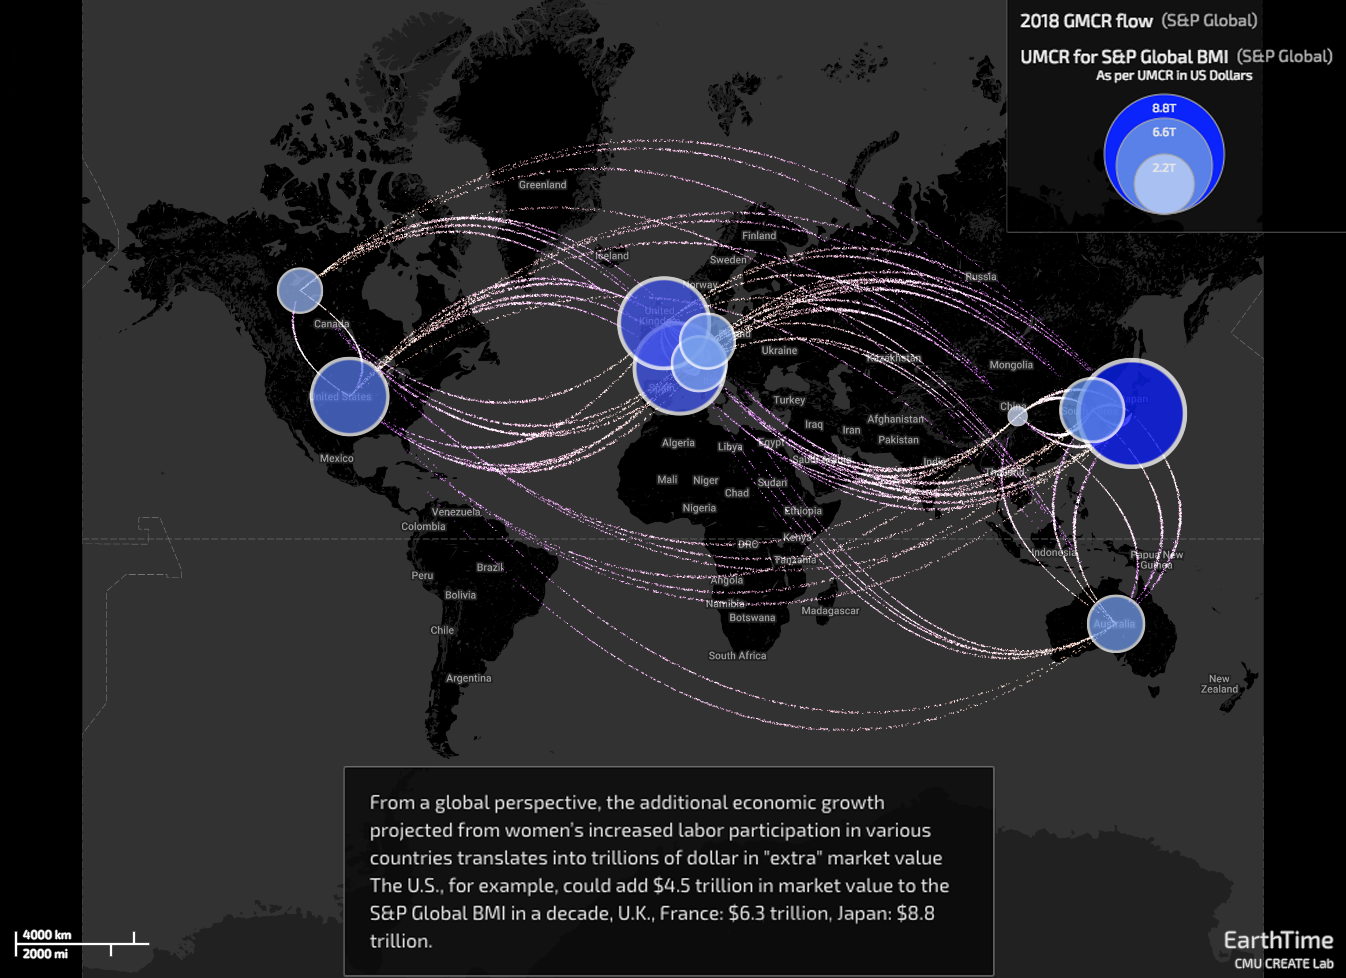
From a global perspective, the numbers are truly astounding. In fact, the additional growth projected from women’s increased labor participation in various countries translates into trillions of dollar in “extra” market value.
The U.S., for example, could contribute $4.5 trillion in market value to the S&P Global BMI in a decade; the U.K. and France, $6.3 trillion each; and Japan an amazing $8.8 trillion (see Illustration 10).
Illustration 10
And while we couldn’t expect all of this to happen together, given the dynamics of capital flows and the finite amount of funds to be invested, even a fraction of the potential effect could add trillions of dollars to market value in a short time.
Clearly, we can’t snap our fingers and boost women’s labor-force participation in these countries to the rates we’ve used as the basis for our analysis. But even a fraction of the totals we’ve outlined would represent a significant boon to a global economy that is showing signs of slowing and equity markets that have suffered sharp corrections—if not quite entering bear territory—amid concerns about a deceleration in global GDP growth, the prospects of a financing squeeze bringing an end to the historic credit cycle, and escalating trade tensions.
Toward this end, there’s been progress on the political front—at least in the U.S. In addition to gaining governorships and making inroads in various statehouses, a record number of women are serving in the House of Representatives as a result of November’s midterm elections. The Senate, too, is welcoming more women. And numerous studies have shown that women lawmakers tend to sponsor legislation that benefits women—such as health and family initiatives—at a markedly higher rate than their male counterparts do. So it should surprise precisely no one to see a number of such proposals come to light.
Either way, it’s clear that countries must find ways to help women overcome the hurdles that stand in the way of their participation in the labor force. The ramifications for economies and markets—and societies more broadly—are just too important.
Additional Contributors:
U.S. Chief Economist Beth Ann Bovino
U.S. Senior Economist Satyam Panday
S&P Dow Jones Indices Managing Director Jodie Gunzberg
Global Head of Strategic Relations and Partnerships Jason Gold
Senior Writer Joe Maguire


