Featured Topics
Featured Products
Events
S&P Global Offerings
Featured Topics
Featured Products
Events
S&P Global Offerings
Featured Topics
Featured Products
Events
S&P Global Offerings
Featured Topics
Featured Products
Events
Language
Featured Products
Ratings & Benchmarks
By Topic
Market Insights
About S&P Global
Corporate Responsibility
Culture & Engagement
Featured Products
Ratings & Benchmarks
By Topic
Market Insights
About S&P Global
Corporate Responsibility
Culture & Engagement
S&P Dow Jones Indices — 14 Apr, 2021
By Ari Rajendra
Following a public consultation that concluded in March this year, S&P DJI announced the new composition of the S&P Global Clean Energy Index, which currently comprises 30 leading clean energy-related stocks, on April 2, 2021. The index is set to broaden when changes take effect on April 19, 2021.
Clean energy is an area that has garnered much investor attention over the past year, fueled in part by falling prices of renewables and growing momentum for carbon neutrality. As the global clean energy sector evolves, the S&P DJI Index Committee aims to have a benchmark that reflects the changing opportunity set.
Methodology Changes Lead to the Introduction of 52 New Stocks1
The index will now aim to add all stocks with the purest clean energy exposure (exposure score of 1) without any limit on target number of companies. If there are fewer than 100 eligible stocks, then companies with lower exposure scores are added (up to 100) without breaching a defined dilution threshold.2
Despite an increase in constituent count, there was a slight decrease in the index’s weighted average exposure score (see Exhibit 1). The expectation of a sizeable reduction in volatility could help improve its risk/return profile as the theme continues to take shape in the years to come.3
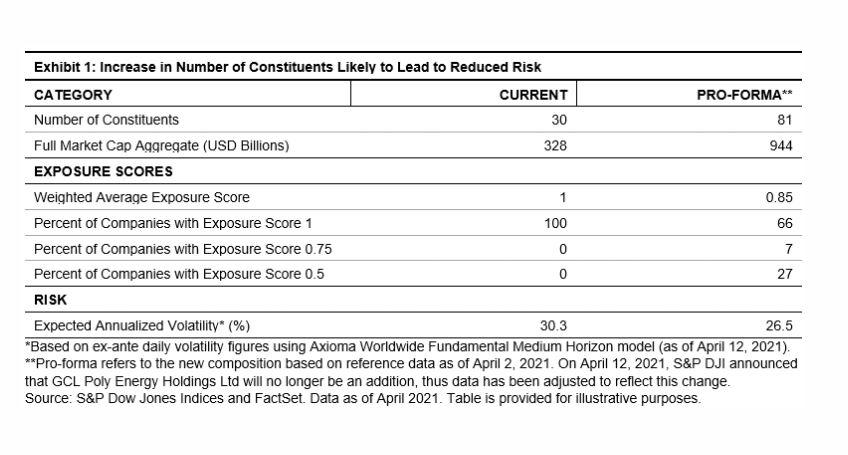
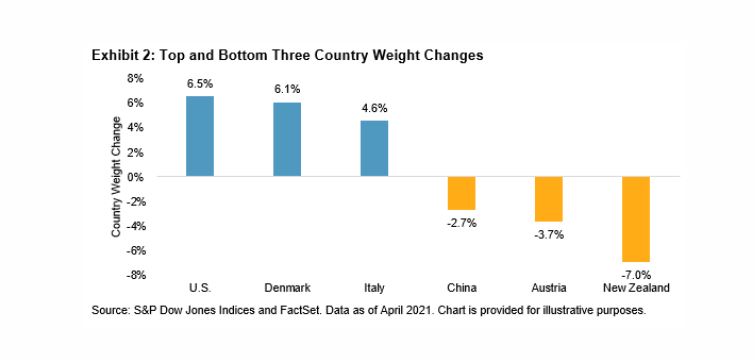
The consultation proposal outlined the goal to reduce constituent concentration, ease liquidity limitation, and improve index replication. The forthcoming changes seek to address these objectives in several ways, including increasing constituent count and introducing a liquidity weight multiple cap.4 Our analysis5 confirms notable improvements.
Exhibit 3 compares the liquidity profile for current and pro-forma compositions, as determined by the individual stock members. The maximum index liquidity is typically determined by identifying the constraining constituent.6 This may not necessarily be the least liquid stock, as the stock weight plays a role too. As shown, the capacity available to trade 90% of the index increases by six times. A similar magnitude of improvement is observed for trading 100% of the index (USD 333 million versus USD 51 million).
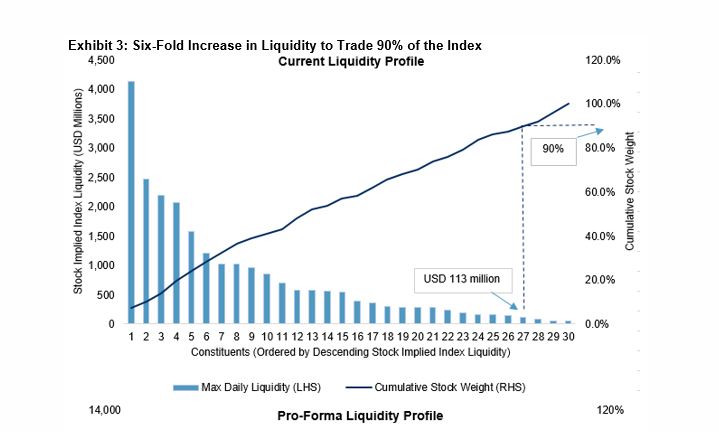
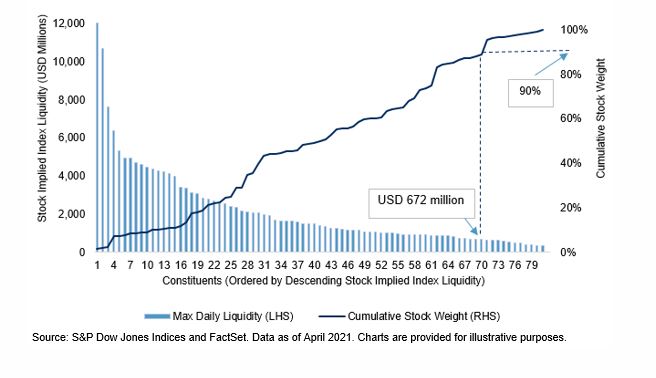
Stock ownership7 is another meaningful measure from an index replication standpoint. Our assessment based on a hypothetical USD 15 billion index portfolio reveals a significant reduction in concentrated ownership (see Exhibit 4), further attesting to the merit of the changes.

While the changes are positive, they will result in a degree of turnover. Our estimates indicate that the one-way turnover is likely to be about 55%.
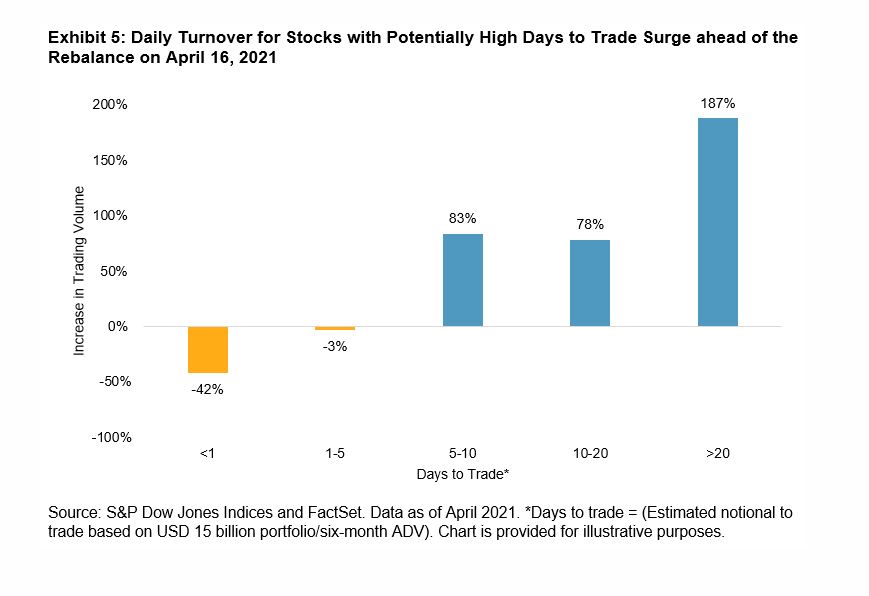
That said, larger rebalance events are typically preceded by an increase in trading activity. To investigate this, we compared the average daily stock liquidity for the six-month period prior to the consultation announcement (six-month ADV) to the volumes since April 2, 2021.5 Exhibit 5 confirms a sharp rise in trading activity for stocks with high days to trade (based on a hypothetical USD 15 billion portfolio and six-month ADV). If volumes remain elevated, the impact of the rebalance may well be attenuated.
During the March 2021 consultation, the Index Committee also proposed to include emerging markets-listed stocks6 and expanding the clean energy business definition to include other eligible segments (e.g., energy storage companies). As these proposals were not intended for implementation in April 2021, S&P DJI intends to publish an additional consultation upon the completion of the upcoming rebalance. S&P DJI continues to monitor and seek feedback to ensure that the S&P Global Clean Energy Index appropriately meets its objective as this segment continues to evolve and develop.
1 Full details of the methodology changes can be found here.
2 Dilution threshold is defined by the index weighted average exposure score, which is set to 0.85.
3 Brzenk, Phillip. “Why Clean Energy Now.” Indexology® Blog. Feb. 2, 2021.
4 Liquidity weight multiple cap is an additional cap imposed to ensure that a stock’s representation is in line with its liquidity. This cap is set at five times. Liquidity Weight Multiple Cap = Multiple*(Stock Liquidity/Aggregate Liquidity of all Stocks)
5 Based on daily tradable liquidity and ownership concentration.
6 Stock implied index liquidity is calculated for each stock in the index by dividing stock daily turnover by stock weight. The stock that implies the smallest value (constraining stock) determines the maximum index liquidity. For daily turnover, we assume 20% participation.
7 Measured by dividing the U.S. dollar notional held in any stock by its total market capitalization.
8 A hypothetical composition was released on March 12, 2021, as part of the S&P Global Clean Energy Index Consultation (based on October 2020 rebalance reference data).
9 Emerging markets stocks listed on developed exchanges are currently included.
The posts on this blog are opinions, not advice. Please read our Disclaimers.
Content Type
Location
Segment
Language