Featured Topics
Featured Products
Events
S&P Global Offerings
Featured Topics
Featured Products
Events
6 Feb, 2020
On the brink of irreversible climate change, a combination of groundbreaking datasets and index innovation is emerging, through which investors will have the choice to align their investments to a future climate scenario compatible with mitigating catastrophic global warming to the planet. This new breed of sustainable climate indices will not only offer solutions that intend to be impactful, but equally aim to provide investors with reduced risks from transitioning to a low-carbon economy and the consequences of physical, environmental events while capturing financial opportunities that arise.
Based on scientific evidence around the need for a 1.5°C1 global warming scenario to be hit (Masson-Delmotte, et al., 2018), the EU Technical Expert Group (TEG) has released its final report (The EU Technical Expert Group on Sustainable Finance, 2019), outlining two new climate benchmarks. This paper describes an S&P Dow Jones Indices (S&P DJI) concept for the eurozone region, which is aligned with the more stringent of these two new climate benchmarks: the Paris-Aligned Benchmark.
The index concept uses pioneering, forward-looking Trucost2 datasets to meet multiple climate objectives, aligned with a 1.5°C scenario and the Task Force on Climate-related Financial Disclosures (TCFD) recommendations, while incorporating the Science Based Targets Initiatives-endorsed climate transition approaches and state-of-the-art Trucost physical risk data.
1 Global warming should not exceed 1.5°C above pre-industrial levels.
2 A part of S&P Global.
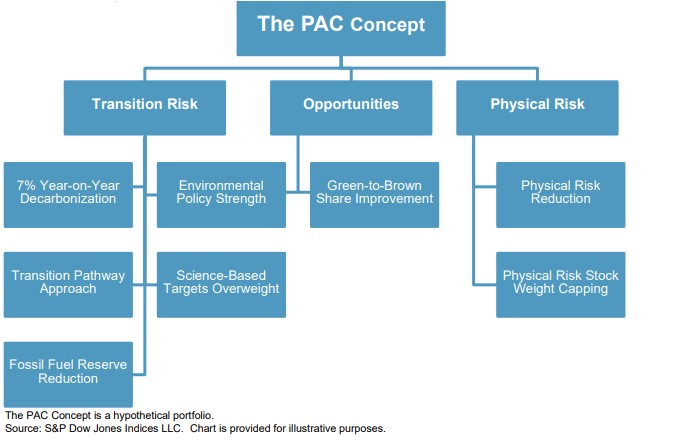
Exhibit 1 outlines the inputs into the S&P Eurozone Paris-Aligned Climate Index Concept (PAC Concept), which enable the climate objectives achievement. This paper outlines how climate-related objectives can be met, due to the use of optimization, while maintaining similar performance to the underlying index, with low tracking error. This results in a broad, diversified index that should perform similarly to the underlying index. Factor analysis shows there to be unexplained alpha that may be driven by the climate strategy of the PAC Concept.
In 2020, the EU will finalize its regulations on climate benchmarks. S&P Dow Jones Indices has defined a Paris-Aligned Benchmark to meet the proposed requirements of this label, while also incorporating further climate-related objectives.
Since the Intergovernmental Panel on Climate Change (IPCC) released its special report Global Warming of 1.5°C (Masson-Delmotte, et al., 2018), there has been growing interest in not only meeting the “well below 2°C” (UNFCCC, 2015) target, as set out by the Paris Agreement, but also ensuring the world transitions to a scenario aligned with 1.5°C above preindustrial levels.
Physical risks of climate change also pose a potentially large financial burden on corporations via risks to assets, operations, and supply chains. The TCFD’s final report (TCFD, 2017) estimates there to be USD 1 trillion investment required per year for the transition to a lower-carbon economy for the foreseeable future. This will likely generate new investment opportunities. Climate risks and opportunities are discussed in further depth later in this paper.
In May 2018, the EU announced its action plan for sustainable finance, which included proposals to create two new climate benchmarks (EU Climate Transition Benchmarks [CTB] and Paris-aligned Benchmarks [PAB]). In December 2019, the law on CTBs and PABs was officially enacted (Regulation (EU) 2019/2089). The EU appointed the TEG to report on the minimum technical standards for these new benchmarks. On Sept. 30, 2019, the TEG released its final report on benchmarks and benchmark ESG disclosures. The report provides proposals to the European Commission that will be used to prepare the delegated acts. Both indices aim to be sustainable using absolute measures by aligning with the 1.5°C scenario, rather than many current low-carbon indices that mainly focus on a relative carbon footprint reduction.
The main objectives of the new climate benchmark regulation (The EU Technical Expert Group on Sustainable Finance, 2019) are to:
1. Allow a significant level of comparability of climate benchmark methodologies while leaving benchmark administrators with a significant level of flexibility in designing their methodologies;
2. Provide investors with an appropriate tool that is aligned with their investment strategy;
3. Increase transparency on investors’ impact, specifically with regard to climate change and the energy transition; and
4. Disincentivize greenwashing.3
3 Greenwashing refers to the process of misleading others about how a company’s business activities are more environmentally friendly than they are in reality
The PAC Concept4 aims to meet and go beyond this proposed regulation using multiple approaches. These include the use of Trucost carbon data and incorporating Science Based Targets Initiative-endorsed transition pathway models: the Sectoral Decarbonization Approach (SDA) (Krabbe, et al., 2015) and the Greenhouse Gas Emissions per unit of Value Added (GEVA) (Randers, 2012). Also included is industry-leading S&P DJI environmental data, based on the Corporate Sustainability Assessment, to assess the strength of policies and disclosures of companies.
Moreover, Trucost’s physical risk dataset is used to reduce the physical risks of climate change by understanding how a company’s assets are exposed to physical risks. This allows for a more holistic view on climate risk, wherein if the world does not transition, even companies that are aligned with a 1.5°C scenario will be exposed to physical risks, which this index aims to hedge. Gaining exposure to climate opportunities is also built into the index, which allows for a more complete view on climate risks and opportunities, as laid out by the TCFD (TCFD, 2017).
Public companies account for around 47% of global carbon emissions, 5 so if an index comprising public companies is compatible with a 1.5°C scenario, it can claim to encompass a significant proportion of global carbon emissions.
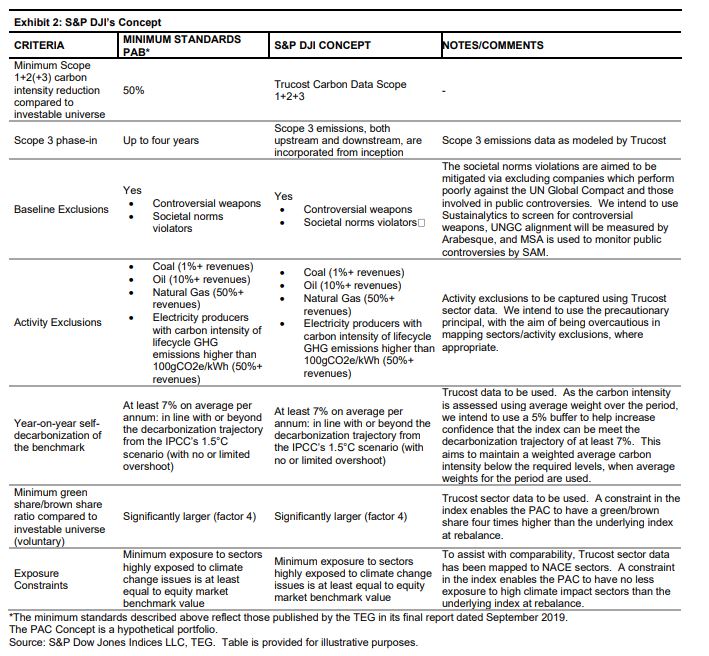
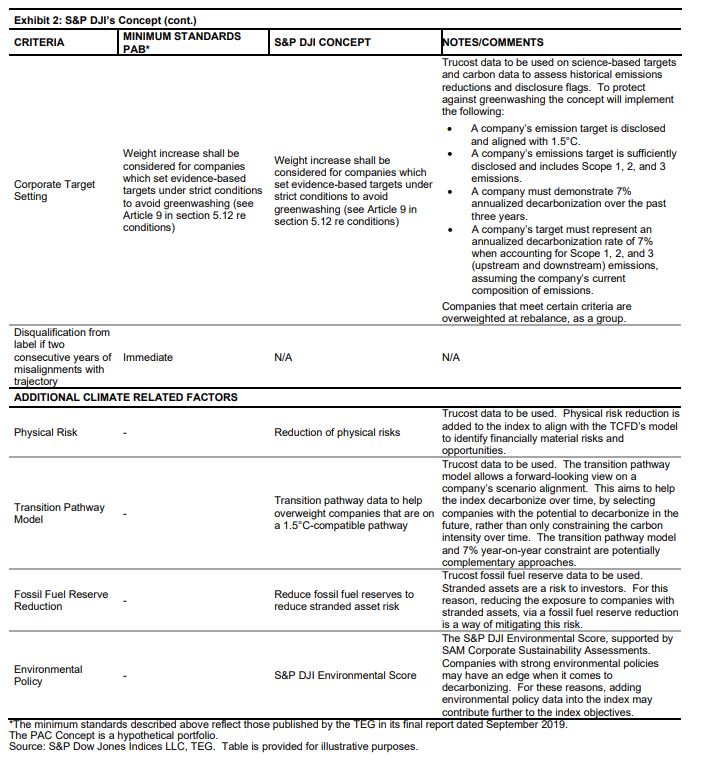
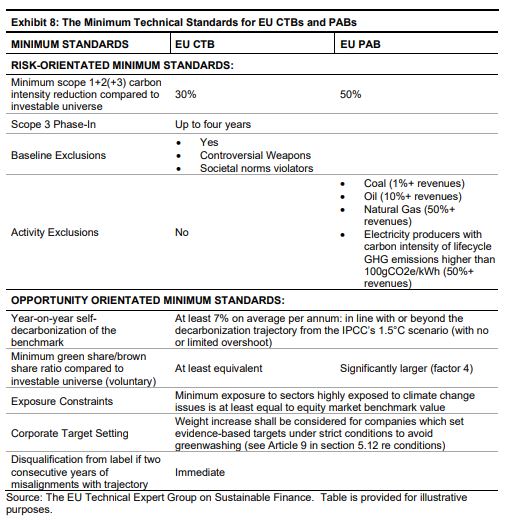
Exhibit 2 outlines how the PAC Concept meets the minimum standards as defined by the TEG, and how it goes beyond the proposed regulation. The table illustrates how the S&P DJI concept intends to: (a) meet the minimum standards for the PAB (as per the TEG’s final report published in September 2019); and (b) incorporate additional climate related factors.
4 S&P DJI’s index aligned with the TEG’s proposed regulation for the PAB.
5 Based on S&P Global BMI constituents (S&P Dow Jones Indices, 2017), using Trucost carbon emissions data and IEX global emissions data.
The difference in impact even between a 1.5°C and 2°C scenario, let alone higher scenarios, is potentially enormous. Between predictions based on 1.5°C and 2°C climate scenarios (Byers et al, 2018), over 90% more people would be impacted by reduced crop yields, just under 90% more would be impacted by habitat degradation, over 30% more from heatwave exposure, over 10% more from hydroclimate risk to power production, and just under 10% more from water stress (see Exhibit 3). This is just the difference between a 1.5°C and 2°C scenario.

Source: IOPScience, “Global exposure and vulnerability to multi-sector development and climate change hotspots,” May 31, 2018. Chart is provided for illustrative purposes.
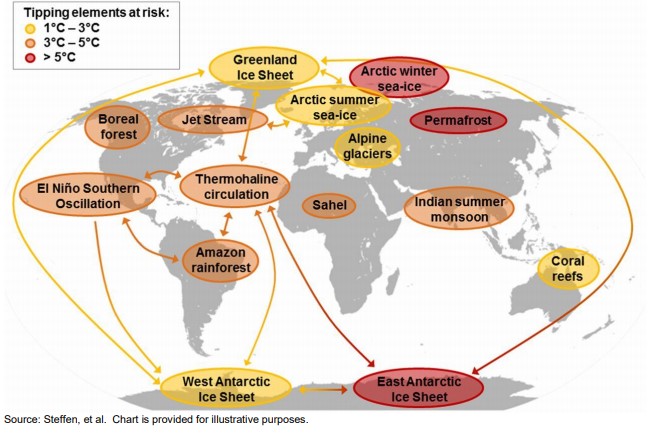
Earth system dynamics can be understood in terms of trajectories between alternate states separated by non-linear interactions, processes, and feedbacks, which resemble characteristics of a complex system (Steffen, et al., 2018). Therefore, the relationship between carbon emissions and climate impact is non-linear. Consequently, tipping points in the climate system, when exceeded, can lead to dramatic, irreversible effects on the climate. The difference between a 1.5°C scenario and a 2°C scenario can cause more of these tipping points to be hit. Due to this non-linearity of emissions and climate impact, this extra 0.5°C of warming could have exponentially more catastrophic impact.
Exhibit 4 shows predicted tipping elements at risk in various climate scenarios.
When looking further into the future, if we do not limit warming to 2°C, or at the very least ensure carbon neutrality, the consequences could be even more dramatic. Carbon neutrality refers to the world having a net zero carbon footprint, either through carbon emissions being balanced with carbon removal or eliminating carbon emissions altogether. “Decisions occurring over the next decade or two could significantly influence the trajectory of the Earth System for tens to hundreds of thousands of years.” This could be the difference between the stabilized Earth we are used to and one that is “unhospitable” to current human societies (Steffen, et al., 2018), let alone other species.
Exhibit 5 illustrates possible future pathways of the climate against the typical glacial-interglacial cycles, where the glacial periods are in the bottom left and interglacial periods in the top right. Glacial periods are those where the Earth is largely covered by large ice sheets, whereas interglacial periods are those, including the past 120,000 years (National Centers for Environmental Information, 2019), without the world’s surface being largely covered by ice sheets.
Exhibit 5 also shows how if the temperature of the earth increases beyond a certain point, a “Hothouse Earth” could be observed, where there is permanent change to the climate and sea levels, which would be irreversible and unhospitable to current human societies.
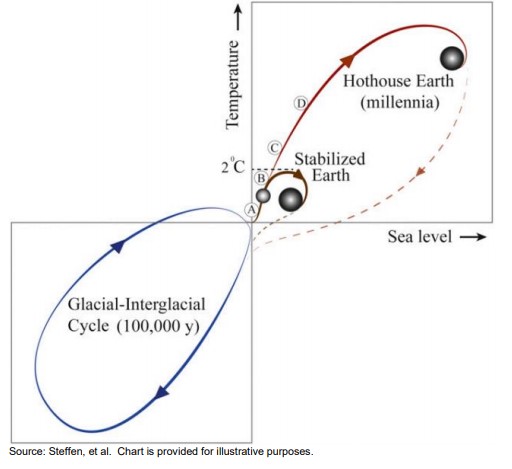
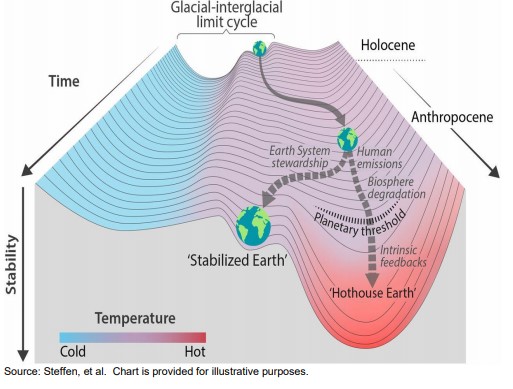
Exhibit 6 further visualizes the stability of the Earth as warming occurs, showing how we are currently on the brink of multiple tipping points, beyond which the system follows an irreversible path. This irreversible path will be due to intrinsic feedback loops activating other tipping points, resembling a series of falling dominos.
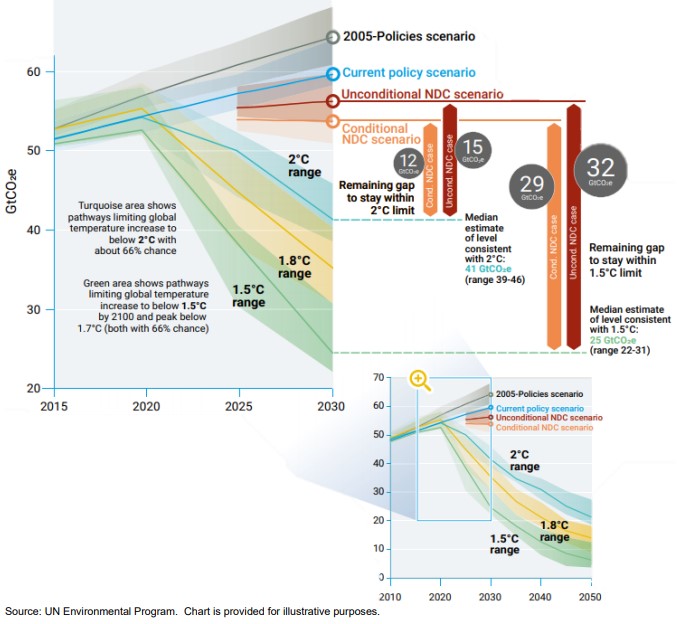
Given the systemic issues with a warming global climate, what trajectory are we currently on and how far off a 1.5°C scenario are we? Exhibit 7 shows the emissions gap between current climate policies and where we need to be for 1.5, 1.8, and 2°C scenarios in 2030. At current policy levels, we will be emitting well over double the emissions required for a 1.5°C scenario by 2030. The nationally determined contributions (NDCs) are countries’ submissions that present their efforts to reach the Paris Agreement’s temperature goal of well below 2°C. Some of these have conditions attached, while others do not.
Overall, to have increased confidence in a stable global climate, action needs to be soon, as incremental temperature rise can cause a cascade of tipping points with irreversible effects.
The Paris Agreement, adopted under the United Nations Framework Convention on Climate Change and approved by the EU on Oct. 5, 2016, aims to bring nations together to combat climate change and adapt to its effects. Furthermore, the Paris Agreement seeks to strengthen the response to climate change by, inter alia, making finance flows consistent with a pathway toward low greenhouse gas emissions and climate-resilient development. In order to reach the objectives of the Paris Agreement and significantly reduce the risks and impacts of climate change, the global target is to hold the increase in the global average temperature to well below 2°C above pre-industrial levels and to pursue efforts to limit the temperature increase to 1.5°C above pre-industrial levels. Sustainability and the transition to a low-carbon, climate resilient, more resource-efficient and circular economy are crucial to ensuring the long-term competitiveness of the economy of the EU. To this end, it is essential that new infrastructure investments are sustainable in the long term.
On March 18, 2018, the European Commission published its action plan on financing sustainable growth. One of the objectives of that action plan is to reorient capital flows toward sustainable investment in order to achieve sustainable and inclusive growth. A key component to achieve this is an increase in private sector funding for environmental and climate-related expenditure, notably through the creation of incentives and methodologies that stimulate companies to measure the environmental costs of their business and the profits derived from using environmental services. The EU believes that it is important to fully exploit the potential of the internal market to achieve those goals. In that context, it is crucial to remove obstacles to the efficient movement of capital into sustainable investments in the internal market and to prevent new obstacles from emerging.
An increasing number of investors are pursuing low-carbon investment strategies and using low-carbon benchmarks to measure the performance of investment portfolios. The establishment of EU CTBs and PABs, underpinned by a methodology linked to the commitments laid down in the Paris Agreement regarding carbon emissions, would contribute to increasing transparency and help prevent greenwashing.
Index providers have used a number of different climate methodologies, and it is not always clear to users whether a particular low-carbon index is aligned to the objectives of the Paris Agreement or aims to lower the carbon footprint of a standard investment portfolio. To address the wide range of indices and divergent approaches and to ensure a high level of consumer and investor protection, the European Commission thought it appropriate to amend Regulation (EU) 2016/1011 by introducing a regulatory framework that lays down minimum requirements for EU CTBs and PABs at Union level.
In order to ensure that the labels “EU Climate Transition Benchmark” and “EU Paris-aligned Benchmark” are reliable and easy for investors across the European Union to recognize, only administrators that comply with the requirements laid down in the regulation should be eligible to use those labels when marketing EU CTBs and PABs in the EU (The EU Technical Expert Group on Sustainable Finance, 2019). Exhibit 8 lays out the minimum technical standards for EU CTBs and PABs. These criteria will have to be fulfilled in order to receive the EU PAB and CTB labels.
In 2017, the TCFD released its final report, with its recommendations on climate-related financial disclosures. Their model of how to assess climaterelated risks, opportunities and financial impacts is shown in Exhibit 9. This defines climate risks into physical and transition risks.
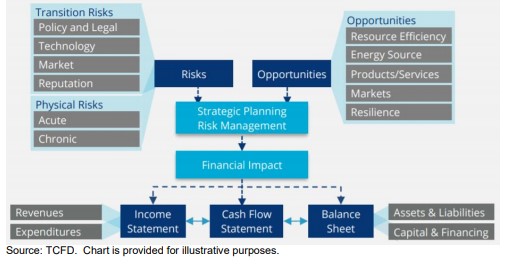
Transition risks include policy and legal, technology, market, and reputational risks. Policy and legal risks include issues such as the increased pricing of GHG emissions (e.g., carbon taxation or emission trading schemes), which can have an impact on companies’ operating costs. Technological risks comprise the substitution of existing products for lower-emission options, which can cause write-offs and early retirement of existing assets. Market risk includes changing consumer behavior that can reduce the demand for high-emitting goods and services. There are also reputational risks to companies that do not transition to lower-emitting practices, which can shift consumer preferences away from them as a brand and ultimately decrease revenues.
Physical risks can be chronic or acute in nature. Acute risks encompass the increased severity of extreme weather events such as hurricanes, floods, etc. Chronic risks include changes in precipitation patterns, rising global temperatures, and rising sea levels. Both chronic and acute physical risks can cause asset write-offs, reduced revenue, and higher costs due to transportation issues and problems in supply chains, alongside increased insurance premiums for high-risk locations.
Transition and physical risks are not a priori connected. Trucost’s physical risk scores and 1.5°C-aligned transition pathway data have an 18% correlation. 6 Therefore, companies that are more aligned to a 1.5°C scenario do not necessarily see lower physical risks, as physical climate risks do not target the worst emitters; they are based on locations of company’s assets and a company’s operational sensitivity to the specific physical risks.
To fully address climate risks, it is essential to reduce both transition and physical risks. If transition risk is mitigated to a large extent, but the world does not decarbonize sufficiently, physical risks will occur more frequently and to a greater extent. A failure to include physical risk in a climate strategy could possibly result in an index with no more climate risk mitigation than a standard market-cap index, or even the potential for higher risk. Even if the world does transition to a 1.5°C scenario, the occurrence of physical climate events will likely be more frequent than they are currently.
Climate opportunities include resource efficiency, energy sources that are consistent with a low-carbon economy, products and services aligned with low emissions, markets, and resilience. These are all potential revenue generators in a less carbon-intensive economy.
does not decarbonize sufficiently, physical risks will occur more frequently and to a greater extent. A failure to include physical risk in a climate strategy could possibly result in an index with no more climate risk mitigation than a standard market-cap index, or even the potential for higher risk. Even if the world does transition to a 1.5°C scenario, the occurrence of physical climate events will likely be more frequent than they are currently.
Climate opportunities include resource efficiency, energy sources that are consistent with a low-carbon economy, products and services aligned with low emissions, markets, and resilience. These are all potential revenue generators in a less carbon-intensive economy.
6 Based on the S&P Eurozone LargeMidCap universe, 2018.
The PAC Concept is aligned with the TCFD model for understanding financially material climate risks and opportunity. As such, the basis for the framework of the PAC Concept is transition risk, physical risks, and opportunities, which can be seen in Exhibit 10. The underlying index for this concept is the S&P Eurozone LargeMidCap.
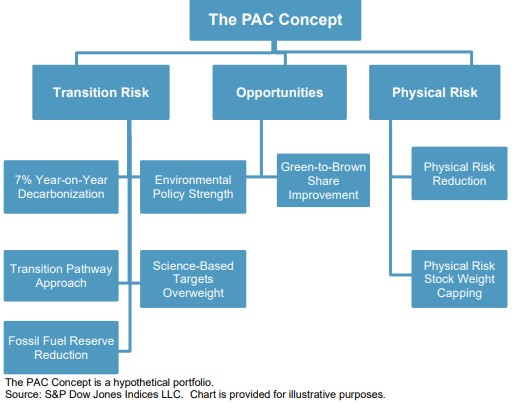
The PAC Concept encompasses many climate-related objectives simultaneously, many of which are not a priori connected. Therefore, optimization can be employed to determine index constituent selection and weights that achieve these multiple objectives in an efficient manner.
Optimization seeks to find an optimal solution through the use of an objective function and a series of constraints, each representing an individual climate objective or desired portfolio characteristic. The objective function is set to minimize active share,7 which allows the PAC Concept weights to be as close to the underlying index weights as possible, while abiding by the constraints. This has the benefit of limiting any unnecessary active risk that is not beneficial to the climate strategy. Minimizing active share in this way can be considered synonymous with limiting the tracking error of the strategy to a feasible level.
Alternative approaches that seek to achieve many unconnected objectives without employing optimization are likely to result in a sub-optimal portfolio, due to having a higher level of company concentration and exposure to untargeted active risks resulting in insufficient control of tracking error. In contrast, the PAC Concept has been designed to be diversified and as representative of the underlying index as possible, thus allowing for the most benchmark-like returns. This will be especially important if the parent index does not decarbonize, which would mean larger relative reductions over time to meet the absolute 7% year-on-year target, as will be discussed in the section “7% year-on-year Decarbonization Constraint.”
Transition risk is addressed within the PAC Concept through weighting companies based on their ability to transition in alignment with a 1.5°C scenario. The index uses the transition pathway models recommended by the Science Based Targets Initiative, with the aim of overweighting companies who will decarbonize through time, while also applying a 7% year-on-year decarbonization constraints to the entire index to avoid any overshoot. Additionally, policy data is used to assess companies’ environmental policies; those with the strongest may be best placed for climate transition. Furthermore, companies who publicly disclose sciencebased targets are overweighted, subject to certain conditions to avoid greenwashing and encourage disclosure. In addition, the fossil fuel reserves of the index are also reduced to help mitigate stranded asset risk.
7 Active share refers to the percentage of the underlying index that would have to be sold in order to invest in the constituents of the PAC Concept.
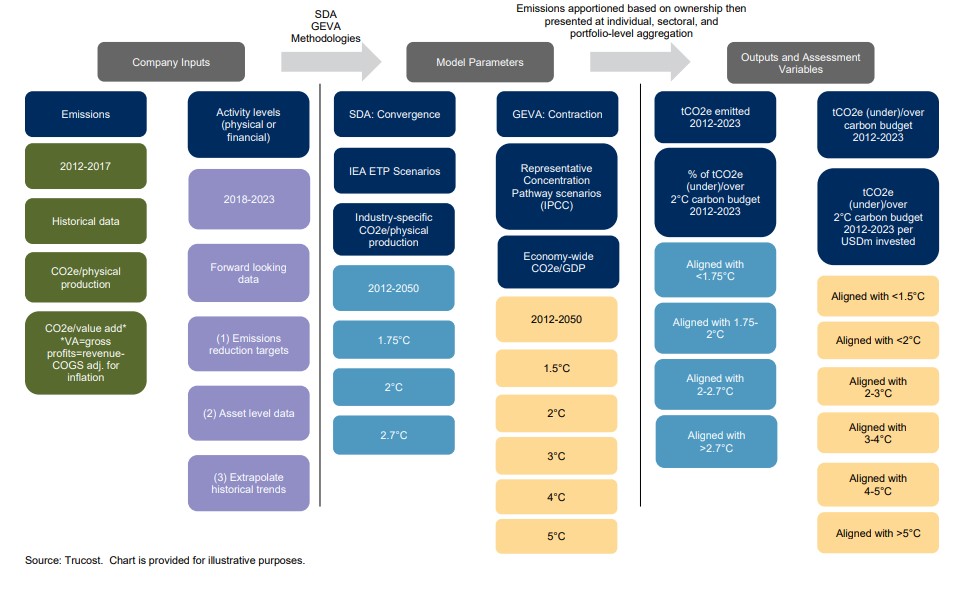
The Trucost transition pathway approach is based on two models previously mentioned; the SDA (Krabbe, et al., 2015) and the GEVA (Randers, 2012) approach, which are both recommended by the Science Based Targets Initiative (Science Based Targets Initiative, 2019). These approaches allow for a forward-looking perspective on likely future greenhouse gas emissions and use a carbon budget allocation method to allocate each company an amount of carbon emissions each year.
Where the approaches differ is how the budgets are constructed. The SDA is sector specific and used for high-emitting sectors. This uses carbon intensity based on specific measures of output. For example, the unit of output for iron and steel companies is “tCO2 per t crude steel”. This allows an understanding of how carbon efficient that companies are, per unit of output. For GEVA, the unit of output used is gross profit. The SDA also sets carbon budgets for specific sectors, as a whole, allowing some to decarbonize more slowly, when the opportunities for decarbonization are far lower. This is allowed by setting more aggressive targets for sectors with greater scope for decarbonization.
GEVA is applied to lower-emitting or heterogeneous business activities. Many companies have diverse business activities, most of which do not have distinct transition pathways defined in climate scenarios.
The weights of companies in the PAC Concept are constrained to ensure they are collectively within the desired budgets for such a scenario. The budget is defined as the sum of all budgets (as calculated using either the SDA or GEVA models) for the period stretching back five years and forward six, including the current year. Using both forward- and backward-looking data enables the approach to encompass both evidence of company emissions in the past and what they are expected to emit in the future.
Exhibit 9 details inputs into the GEVA and SDA models, the model parameters, output, and assessment variables.
To ensure a 1.5°C scenario, the required rate of decarbonization is 7%, annualized (in accordance with the trajectory implied by IPCC’s 1.5°C scenario). To aid the SDA and GEVA, the index implements constraints to ensure that it decarbonizes at this 7% year-on-year figure, after inflation is accounted for. This ensures there is no overshoot. If there were to be overshoot, it would mean more carbon would have to be taken out of the atmosphere, even if the world does become carbon neutral by 2050.
As companies’ values increase, they can have the same carbon emissions and same output but reduced carbon intensity, when enterprise value is used to measure the carbon intensity. 8 A company increasing their enterprise value will not aid climate transition if carbon emissions are unchanged. Therefore, enterprise value fluctuations are accounted for, to ensure inflation is not a driver of decreasing carbon intensity.
Exhibit 12 illustrates the path dependency of the PAC Concept on the parent index. As the level of emission reduction required for a 1.5°C scenario is absolute, this means over time, the relative carbon reduction required, at any point in time, to hit the 7% year-on-year target will be dependent on the decarbonization of the parent index. Therefore, at each point in time a relative decarbonization required is unknown.
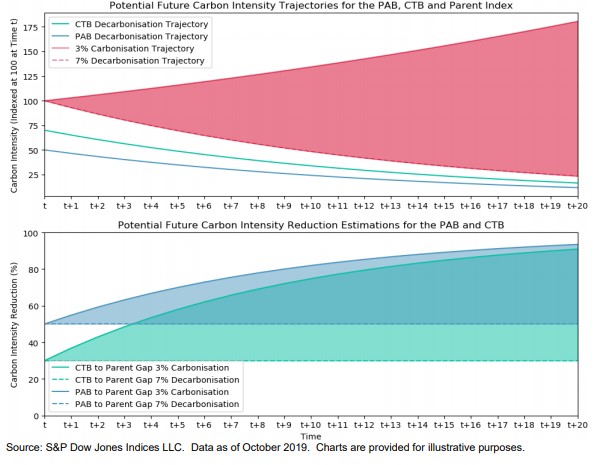
For this reason, the objective function for the optimization is to minimize active share, which should minimize the decarbonization goal’s impact on tracking error. Alternative strategies that do not use optimization could see drastic increases in tracking error as the relative decarbonization becomes greater through time.
8 When: carbon intensity = carbon emissions / enterprise value
Both the 7% year-on-year decarbonization and the transition pathway approach are methods of aligning the index with a 1.5°C scenario. These constraints interact with each other and aid in the reduction of transition risk of the PAC Concept.
There is a key difference between a prediction that a given company will be under its carbon budget and its actual likelihood of decarbonization. Both are important and complementary. The transition pathway approach has a forward-looking element, which allows the index to overweight companies that are likely to decarbonize in line with their carbon budget. This helps the index organically self-decarbonize, since the footprint reduction comes from current constituents reducing their carbon emissions.
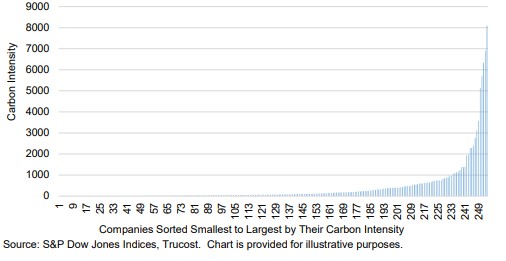
While we believe the transition pathway approach will allow for decarbonization over the long term, the EU PAB regulation requires precise carbon footprint reductions over the short term to maintain its label. However, a large proportion of the index’s carbon intensity is from a small number of companies (see Exhibit 13). Therefore, to decarbonize the index using the above pathway approach alone, it would be necessary to accurately predict the change in short-term emissions of a select few companies.
For this reason, implementing the additional 7% year-on-year decarbonization constraint ensures the index decarbonizes in the short term, without overshoot, while transition pathway predictions allow for organic self-decarbonization.
Companies with strong environmental policies are likely in a better position to be compatible with a 1.5°C scenario. For this reason, we ensure the index has improved environmental policy credentials, as measured by the S&P DJI Environmental Score. This score provides insights into financially material aspects of a company’s climate strategy, environmental policy and management systems, electricity generation, environmental business risks and opportunities, low-carbon strategy, recycling strategy, co-processing, and more.
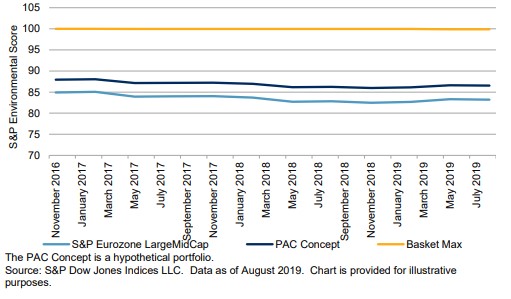
The PAC Concept receives a weighted average increased S&P DJI Environmental Score relative to the underlying index, by 20% of the possible improvement.
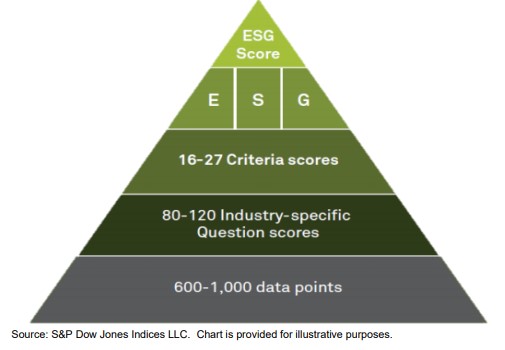
The S&P DJI Environmental Score is based on the SAM Corporate Sustainability Assessment, which ranks as the highest quality of all ESG rating providers, as rated by sustainability professionals (SustainAbility, 2019). 9 The makeup of the S&P DJI ESG scores is shown in Exhibit 14.
9 About 70% of these professionals have over 10 years’ experience.
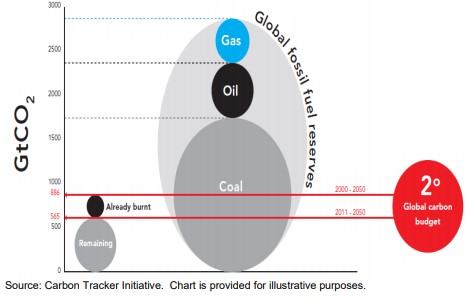
For the world to limit global warming to no more than 2°C since preindustrial levels, 80% of all known proven and probable fossil fuel reserves must stay in the ground, as illustrated in Exhibit 15. To meet a 1.5°C scenario, this will be an even higher figure. Valuations of fossil fuel companies assume both proven and probable reserves will be realized, which suggests that fossil fuel companies may be overvalued if carbonlimiting regulations are successfully implemented to achieve the goals of the Paris Agreement. If these reserves must be written off by policies to mitigate carbon emissions, there could be large repricing effects, with fossil fuel companies losing value. Due to this, the PAC Concept reduces fossil fuel reserves by a minimum of 80% to minimize the risk of stranded asset write-downs.
Companies with publicly disclosed science-based targets will be overweighted using the following criteria to avoid greenwashing.
1. The target is publicly disclosed and is 1.5°C aligned
2. The targets set includes all scope 1, scope 2, and scope 3 emissions
3. The company discloses their scope 1, scope 2, and scope 3 emissions sufficiently
4. Companies must show a 7% annualized decarbonization over the past three years
5. Companies’ targets must represent an annualized decarbonization rate of 7% when accounting for scope 1, 2, and 3 (upstream and downstream) targets, assuming the companies’ current composition of emissions
Companies that have publicly disclosed science-based targets become accountable to investors to ensure they hit these targets. This disclosure also means companies are thinking actively about transitioning and thus are likely better placed to reduce their transition risk.
The PAC Concept rewards the group of companies that pass the above criteria with an overweight of 20%, as a group. This allows for some to still be overweighted by more than this and potentially for some to be underweighted. This flexibility permits other climate objectives of the PAC Concept to be achieved simultaneously.
Including scope 3 emissions, both upstream and downstream, is important to understand the full picture of a company’s emissions that occur throughout the value chain. Simply looking at scope 1 and 2 emissions is a good start; however, the ratio of scope 1+2 and scope 3 emissions is not constant between sectors within the S&P Eurozone LargeMidCap. Exhibit 16 shows how the ratios of scope 1+2 and scope 3 emissions are not constant between sectors. Energy has high levels of scope 1+2 emissions, but its scope 3 emissions are 2.5 times higher than any other sector, while its scope 1+2 are less than one-fourth of the highest-emitting sector, Utilities.
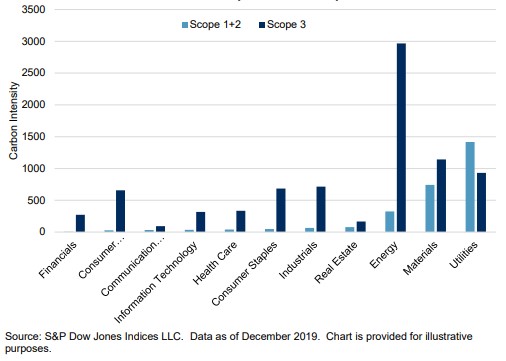
For this reason, incorporating scope 3 emissions helps give a fuller understanding of a company’s impact on the climate. This enables a more complete assessment of company’s transition risk.
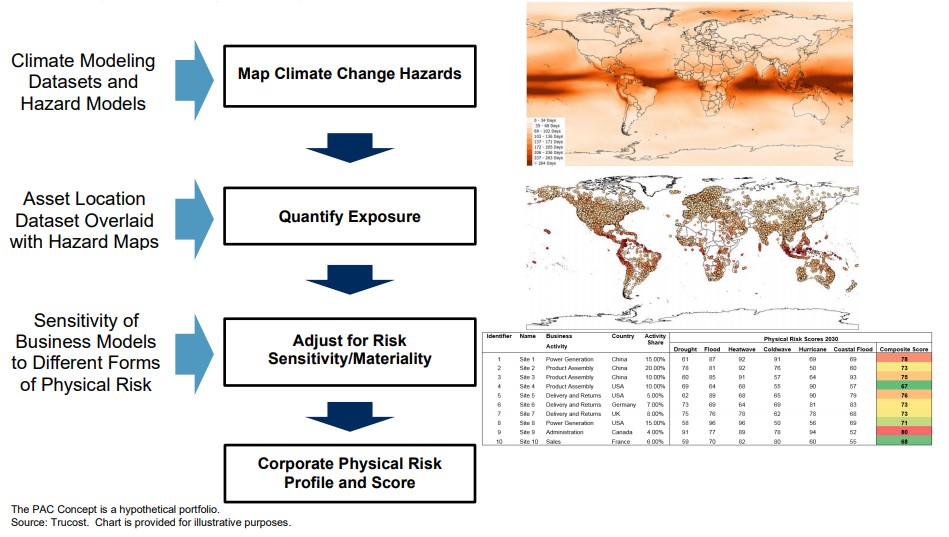
Exhibit 17 represents the Trucost physical risk methodology. This allows users to understand the risk and sensitivity of company assets to the physical risks of climate change. Climate modeling datasets and hazard models are overlaid with the asset locations of companies. These datasets and models have been created for each specific physical risk. The physical risks include wildfires, cold waves, heatwaves, water stress, sea level rise, floods, and hurricanes.
Sensitivity analysis is carried out for each asset to assess whether a company’s operations would be affected by each specific physical risk, based on the asset type. For example, corporate offices are less sensitive to water stress than beverage manufacturing plants because they are less water intensive. However, corporate offices are more sensitive to heatwaves because they could cause the productivity of workers to fall.
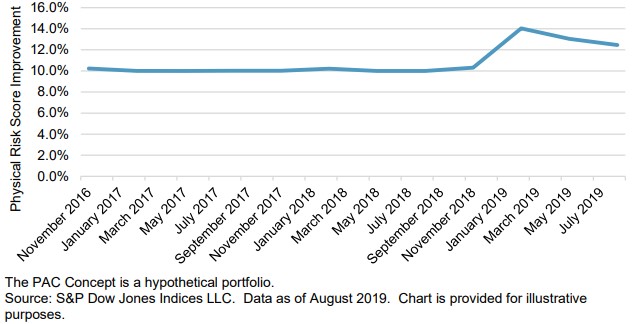
The PAC Concept as a whole sees a physical risk reduction of 10%. Furthermore, individual companies’ weights are dynamically capped in relation to their physical risk score. As physical risks of climate change are partially a tail risk event, the index aims to cap this tail risk.
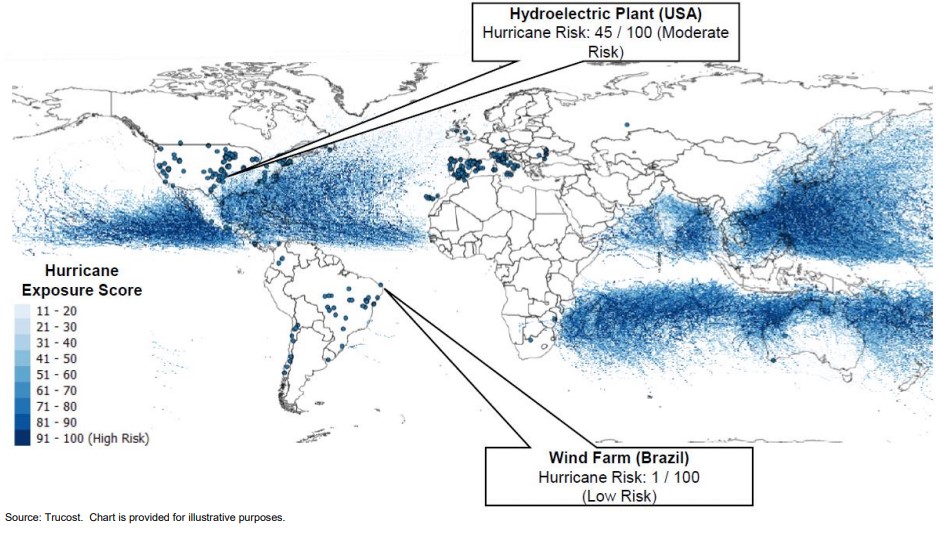
Exhibit 18 gives an example of how a hurricane hazard model map can be overlaid with the assets of global energy companies to understand their exposure to hurricane risk.
Climate opportunities are addressed by improving the green-to-brown ratio of the PAC Concept with respect to the underlying index. This means that the PAC Concept will gain greater exposure to green power generation sectors relative to brown ones. These sectors can be seen in Exhibit 19.
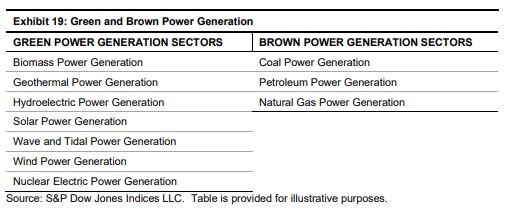
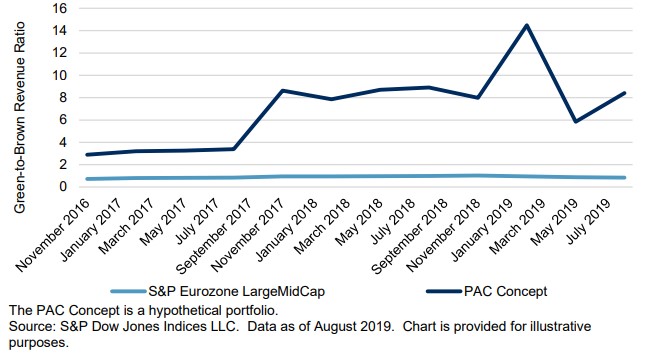
The PAC Concept should have an improvement in the ratio of green-tobrown revenues by at least a factor of four compared with the underlying index. This enables the index to overweight companies with more exposure to renewable energy, which is set to be in high demand in a lower-carbon economy.
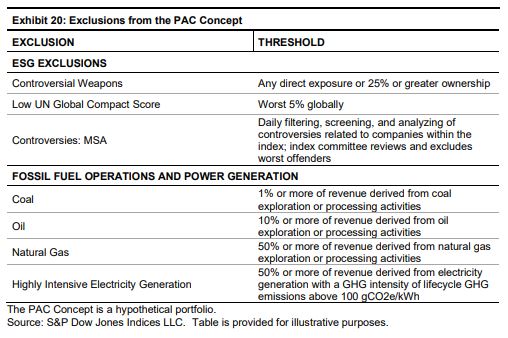
The PAC Concept excludes companies for controversial weapons, as a consensus around the exclusion of controversial weapons has been reached (The EU Technical Expert Group on Sustainable Finance, 2019). Companies that score poorly against the UN Global Compact are also excluded, as they are most at risk of violating global norms. This is recommended by the TEG as a basis for exclusion, as a part of the “Do No Significant Harm Principle.” Companies with tobacco exposure are also excluded, as these are companies which are usually difficult for investors to engage with, due to all or the vast majority of their revenue coming from tobacco exposures. Companies involved with public ESG-related controversies are also excluded. The TEG recommend this specifically for a set of climate-related controversies, but the PAC Concept goes above and beyond the TEG recommendations and excludes all ESG controversies. These are monitored using the SAM Media & Stakeholder Analysis (MSA) methodology. The MSA process involves monitoring of news and assessing any current or ongoing controversies related to companies. These exclusions can be seen in Exhibit 20.
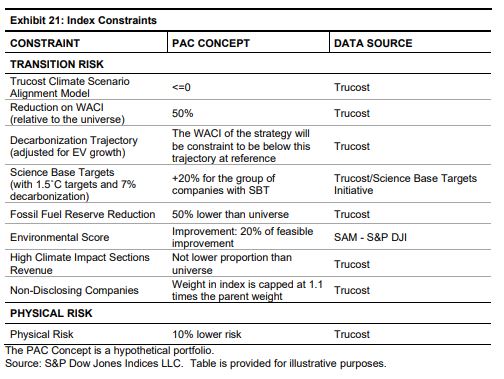
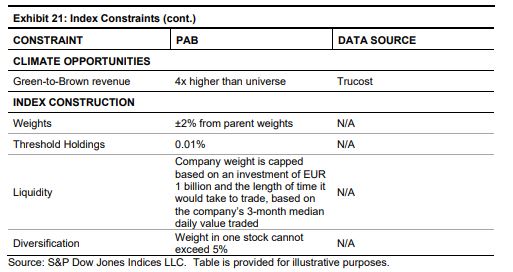
The PAC Concept is weighted to minimize the difference in weights to the S&P Eurozone LargeMidCap, while also maintaining the constraints shown in Exhibit 21.
The main areas where index methodology goes beyond the objectives as required by the TEG proposed regulation are:
1. The inclusion of physical risk mitigation to align with the TCFD model of financially material climate risks and opportunities;
2. The use of transition pathway methodologies, as endorsed by the Science Based Targets Initiative, to weight constituents according to their level of alignment to a 1.5°C scenario;
3. Ensuring stranded asset risk is minimized by reducing the fossil fuel reserve footprint of the PAC Concept;
4. Minimizing active share as the objective function allows the index to meet its objectives in the most efficient manner; and
5. Scope 3 data is incorporated from inception.
TRANSITION RISK
TRANSITION PATHWAY
Exhibit 22 shows how companies that are more aligned with a 1.5°C scenario often see an increased weight in the PAC Concept (companies with carbon budgets below 0 are 1.5°C aligned, and the further below 0 the figure is, the further below their carbon budget they are).
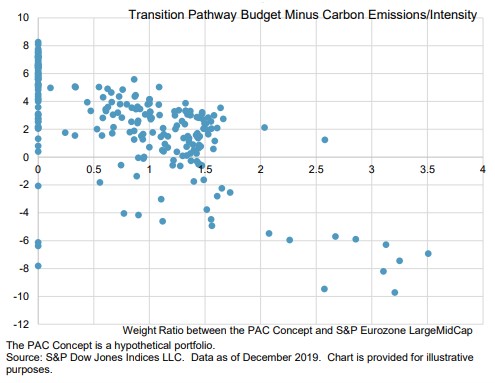
Exhibit 23 shows the carbon intensity of the S&P Eurozone LargeMidCap and the PAC Concept against the decarbonization trajectory. The decarbonization trajectory has been fixed at the initial rebalance date, Dec. 31, 2016, with a 50% reduction in carbon intensity relative to the S&P Eurozone LargeMidCap. Following that initial value, the trajectory is designed to decarbonize at 7% year-on-year.
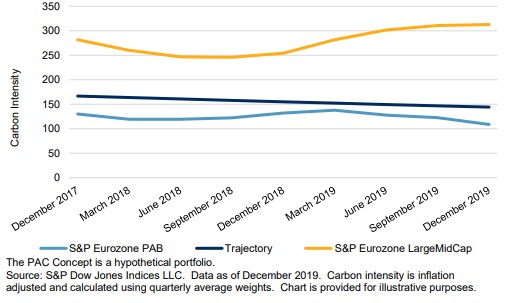
Exhibit 23 also shows that the back-test has always satisfied both a carbon intensity below the 7% year-on-year trajectory and 50% lower carbon intensity than the S&P Eurozone LargeMidCap. In certain periods (e.g., March 2018-September 2018), the 50% reduction from the carbon intensity of the underlying index is a stronger constraint than the decarbonization at 7%, due to the decarbonization of the underlying index in this period.
The chart has been calculated following the proposed EU regulation. This implies carbon intensity has been adjusted for inflation and average weights through the quarter have been used to calculate the carbon intensity. This stops a carbon intensity reduction due to rising enterprise values across the index over time.
In order to assess a company’s environmental policies and performance against them, the PAC Concept increases the weighted average S&P DJI Environmental Score by 20% of a possible improvement, relative to the S&P Eurozone LargeMidCap. This can be seen in Exhibit 24, where the PAC Concept ensures the S&P Environmental Score is improved throughout the back-test.
To mitigate physical risks of climate change over time, the PAC Concept reduces the weighted average physical risk. It can be observed in Exhibit 25 that physical risk reduction is constant at the level set by the constraint, until the November rebalance in 2018. This shows that, to see physical risk mitigation consistently over time, physical risk must be targeted explicitly within index design.
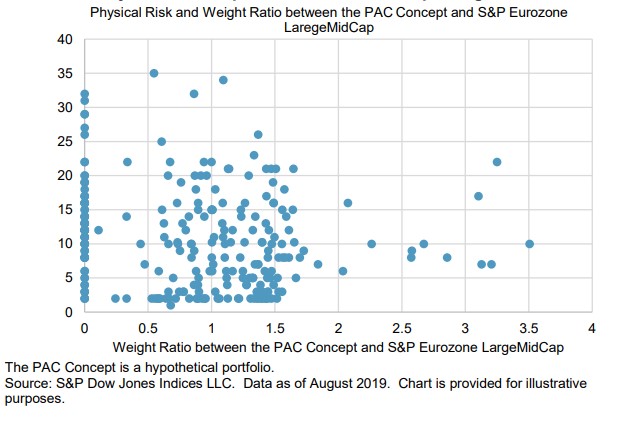
Furthermore, the PAC Concept implements a dynamic cap on company weights, based on their level of physical risk. This physical risk dataset aims to minimize tail risk. As such, the weights of companies with high exposure and sensitivity to physical risks are capped. Physical risk score improvement in the index may exceed the required 10% as a result of this capping rule. Alternatively, other constraints in the optimization may only offer feasible solutions above the required physical risk improvement. Exhibit 26 shows how companies with higher physical risk do not receive large overweights. Within the S&P Eurozone LargeMidCap, there are companies with relatively low physical risk.
The TEG set out a green-to-brown ratio improvement by a factor of four as a voluntary objective. Exhibit 27 shows how early in the back-test the four times green-to-brown share constraint is used. However, after mid-2017, the green-to-brown share grows significantly. This is likely due to the 7% carbon intensity reduction requirement, as the relative level of carbon intensity reduction increases. Regardless of any changes in the future relationships between constraints, the index will always respect the four times improvement in green-to-brown ratio as a minimum.
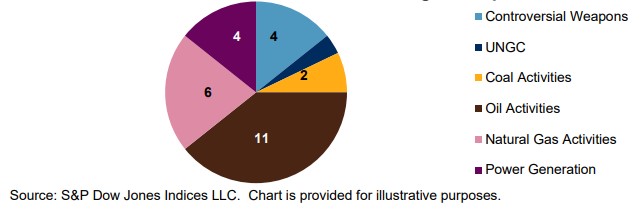
At the November 2019 rebalance, of the 254 constituents of the S&P Eurozone LargeMidCap, only 185 made it to the PAC Concept. Twentythree companies were excluded due to the exclusion criteria laid out in Exhibit 20. Exhibit 28 shows how many stocks fell within each exclusion criteria. Some companies were excluded due to multiple exclusion criteria. The remaining companies not in the PAC Concept were due to their alignment with the climate goals of the index, where if their optimized weights were lower than 1 basis point, they were removed from the index. While companies are hypothetically excluded for tobacco exposure, there were no companies with tobacco exposure, as laid out in Exhibit 20.
The PAC Concept has been designed to track the S&P Eurozone LargeMidCap as closely as possible, while satisfying the constraints outlined in Exhibit 21. Over the period studied, the strategy had a 1.2% tracking error and similar risk/return profile as the following charts show. Table 12 shows the index total return levels for the PAC Concept and the S&P Eurozone LargeMidCap and Table 13 shows the risk and return. Exhibit 23 shows how similar the returns of the PAC Concept and the S&P Eurozone LargeMidCap are.
The PAC Concept outperformed the S&P Eurozone LargeMidCap over the past year; however, there was a slight underperformance over the whole period. Exhibit 30 also shows the returns of the S&P Eurozone LargeMidCap after exclusions, which underperformed the PAC Concept both over the past year and over the whole back-tested period, showing slight financial outperformance caused by the strategy, after exclusions are controlled for. Exhibit 30 shows how similar the daily total returns were between the S&P Eurozone LargeMidCap and the PAC Concept. This also shows the active share required for the exclusions alone and for the PAC Concept.
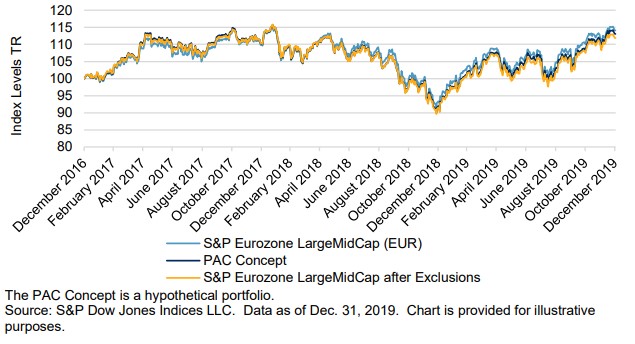
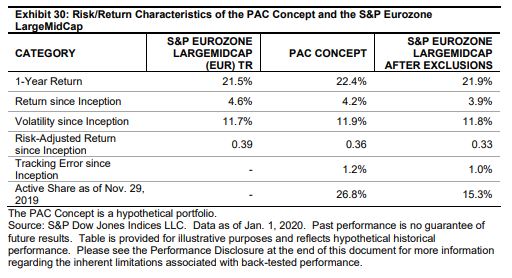

Exhibit 32 shows how the exclusions and then PAC Concept strategy affected the tracking error, with respect to the PAC Concept. By simply excluding companies, based on the exclusion criteria in Exhibit 21, there was a tracking error of 1%. The tracking error between the S&P Eurozone LargeMidCap after exclusions and the PAC Concept is 0.6%. However, this 0.6% tracking error is not additive to the tracking error from the S&P Eurozone LargeMidCap and the PAC Concept. The tracking error between the PAC Concept and the S&P Eurozone LargeMidCap is just 1.2%. This illustrates how the active share minimization is affecting the index, with the aim of fulfilling the constraints and exclusions as efficiently as possible with regards to the active share.
![]()
Risk factor analysis attributes the underperformance of the PAC Concept (against the S&P Eurozone LargeMidCap) entirely to industry and factor effects. Exhibit 33 shows the breakdown of industry-, factor-, and stockspecific effects.
Industry exposures are usually not considered rewarded risks, so this underperformance attributed to the industry effect should not necessarily be expected to continue.
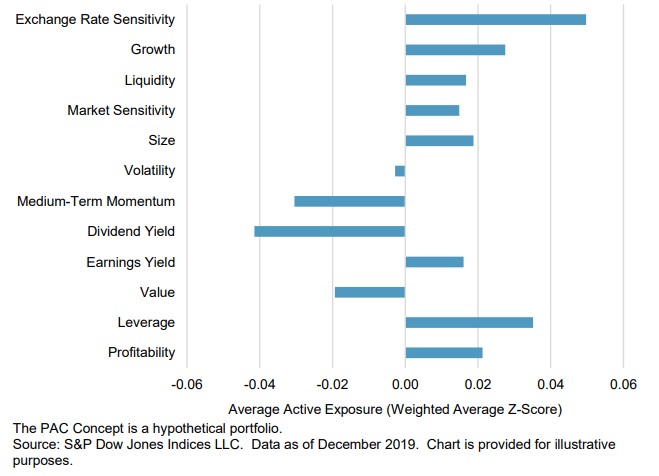
The negative impact on return from factors is a result of the collective factor exposures of the PAC Concept. The highest positive exposures were exchange rate sensitivity and leverage, while the highest negative exposures were dividend yield and momentum. These and other factor exposures can be seen in Exhibit 34.

Comparing the PAC Concept with the S&P Eurozone LargeMidCap after the proposed regulation exclusions, the PAC Concept shows outperformance. Exhibit 35 shows the risk-based active return attribution against this new benchmark.

The risk-based return attribution shows that active returns after accounting for exclusions are predominantly a result of stock-specific effects. Industry and factor effects are positive when also analyzing against the same benchmark after exclusions. This suggests that the index’s exclusion rules, as prescribed by the TEG’s final report, are most responsible for the negative industry and factor effects observed in Exhibit 33.
Observing a positive specific effect elicited from the PAC Concept, when benchmarked against both the S&P Eurozone LargeMidCap and the S&P Eurozone LargeMidCap after exclusions, implies an outperformance that is not captured by any factors within the performance attribution. These factors include six market-based factors, six fundamental factors, 58 industry factors, the European market factor, country factors, and currency factors. This unexplained alpha may be driven by the climate strategy of the PAC Concept.
As the TEG distinguishes between high- and low-climate-impact sectors, the former of which have their weights constrained, below are case studies that represent a range of companies with low and high exposure to highclimate-impact sectors.As the TEG distinguishes between high- and low-climate-impact sectors, the former of which have their weights constrained, below are case studies that represent a range of companies with low and high exposure to highclimate-impact sectors.
As there are many exclusions based on coal, oil, natural gas, and highly intensive electricity generation there are many companies with high exposure to high-climate-impact sectors that are excluded. To keep the high-impact sector neutrality, remaining companies with exposure to highclimate-impact sectors are often overweighted. For this reason, it is sensible to compare companies within the same sector.
These case studies are based on the most recent rebalance reference date in November 2019.
In the Utilities sector, when comparing Electricite de France (EDF) and RWE AG, it can be observed that they are at opposite ends of the scale when it comes to their climate impact. Both have large revenues from highimpact sectors, as defined by the TEG.
EDF was excluded in the history of the back-test until the August 2019 rebalance, due to its highly intensive electricity generation; however, as it has reduced its carbon intensity, it has met thresholds to be included in the index. Not only has it been included in the index, but it has a heavy overweight (one of the highest overweights of all companies, relative to its weight in the S&P Eurozone LargeMidCap). This is largely due to its strong 1.5°C alignment, based on Trucost’s transition pathway alignment model. Furthermore, it has 25 times more green revenues than RWE AG per dollar invested, a carbon intensity that is almost 15 times lower, and far stronger environmental policies (and alignment with these policies), as measured by the S&P DJI Environmental Score.
This means EDF has 225% more weight in the PAC Concept than it does in the underlying index, while RWE has no weight in the PAC Concept, without being excluded based on any of the criteria in Exhibit 20.
This large difference between best and worst in class within the Utilities sector causes their weights in the PAC Concept to differ substantially from both each other and their weights in the underlying index.
In the Materials sector, Koninklijke DSM NV has strong climate credentials, while ArcelorMittal Inc is weaker. Both have large revenues from highimpact sectors, as defined by the TEG.
Koninklijke DSM NV has a carbon intensity almost 45 times lower than ArcelorMittal Inc and is aligned with a 1.5°C scenario, while ArcelorMittal Inc is well over its allotted carbon budget for a 1.5°C scenario. Furthermore, Koninklijke DSM NV has stronger environmental policies, as measured by the S&P DJI Environmental Score. Koninklijke DSM NV also has lower levels of physical risk.
Over time Koninklijke DSM NV has seen its weight grow rapidly in the PAC Concept. This has been largely due to its reduction in carbon intensity, which has fallen by around 2.5 times. This in turn means it has gone from not being 1.5°C aligned in 2016 to now being 1.5°C aligned, based on Trucost’s transition pathway approach. This relative weight change can be observed in Exhibit 36.

Within the Financials sector, Banco Santander SA has better climate credentials than Munich Re AG. This results in 45% overweight for Banco Santander SA and 30% underweight for Munich Re AG. Neither of these companies have exposure to high climate impact sectors, as defined by the TEG.
The big difference between the two is their carbon intensity. Munich Re AG has a carbon intensity 10 times higher than Banco Santander SA, which is the main driver of the difference in weight between the two in the PAC Concept, relative to the S&P Eurozone LargeMidCap. Other climate metrics are fairly similar.
Exhibit 37 shows the difference in weighting over time, relative to the parent index, for Banco Santander SA and Munich Re AG. This shows that Banco Santander SA had a fairly stable overweight over time, whereas Munich Re AG was consistently underweighted.

Two of the most contrasting companies, based on climate alignment within the Information Technology sector, are SAP SE and Nokia OYI. Nokia OYI has an underweight of around 50% while SAP is overweighted by 45%, relative to their weights in the S&P Eurozone LargeMidCap.
This is largely due to SAP being superior on multiple measures. Its carbon intensity is 11 times lower, it is better aligned to a 1.5°C scenario, and it has stronger environmental policies (and alignment with these policies), as measured by the S&P DJI Environmental Score.
What is particularly interesting is that SAP has been consistent in its weighting; however, Nokia OYJ has seen its weight fall from a high overweight to being underweighted, as shown in Exhibit 38. Since the rebalance at the end of November 2016, Nokia OYJ has seen its carbon intensity more than double , its S&P DJI Environmental Score has fallen, and it has become less aligned with a 1.5°C scenario; in 2016, it was aligned with a 1.5°C scenario, whereas now, it is not.

Within the overall scientific community, there is a consensus on the need for the world to decarbonize, which has been supported by scientific research and has inspired these new EU regulatory proposals. The PAC Concept has been designed not only with the regulation in mind, but also to encompass risks and opportunities of climate change, as set out by the TCFD, while meeting the proposed regulation from the TEG.
The PAC Concept shows a similar risk/return profile in the back-test to the underlying index. This performance happened while also reducing the transition risks of climate change by:
The PAC Concept also incorporates physical risk mitigation to hedge against physical risks of climate change, which could be particularly important if the world does not transition. Furthermore, climate opportunities are accessed via overweighting companies that have greater exposure to green sectors, such as renewable energy.