Featured Topics
Featured Products
Events
S&P Global Offerings
Featured Topics
Featured Products
Events
S&P Global Offerings
Featured Topics
Featured Products
Events
S&P Global Offerings
Featured Topics
Featured Products
Events
Language
Featured Products
Ratings & Benchmarks
By Topic
Market Insights
About S&P Global
Corporate Responsibility
Culture & Engagement
Featured Products
Ratings & Benchmarks
By Topic
Market Insights
About S&P Global
Corporate Responsibility
Culture & Engagement
S&P Dow Jones Indices — 9 Mar, 2021
This article is reprinted from the Indexology blog of S&P Dow Jones Indices.
The S&P 500® was launched on March 4, 1957, and so yesterday marked its 64th birthday. To celebrate this milestone, a number of my colleagues and I recently appeared on our Index Investment Strategy team’s weekly call (sign up for the daily dashboard to receive the invite). If you couldn’t make it, here are a few highlights.
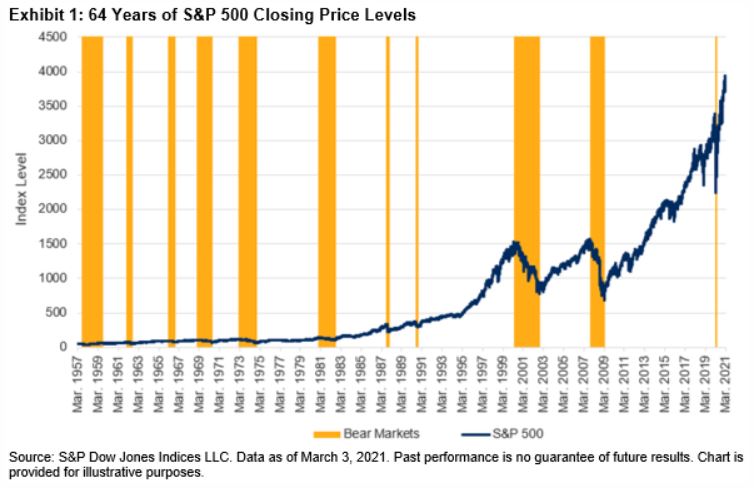
Exhibit 1 shows the S&P 500’s closing price levels over its live history. Eleven bear markets captured periods of pessimism, while the intervening recoveries reflected improved outlooks. Overall, the index posted an annualized price return of around 7.2% over the last 64 years.
Representing the Large-Cap U.S. Equity Market
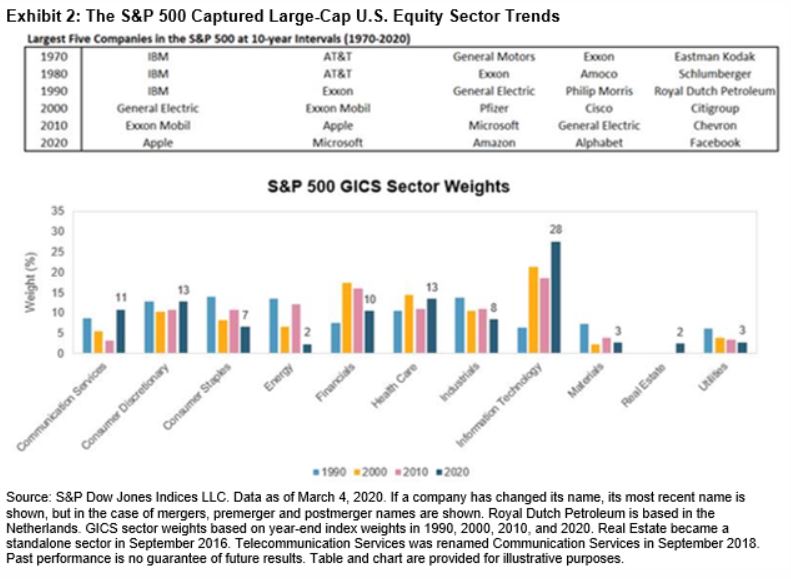
The S&P 500 represents the large-cap segment of the U.S. equity market. The index is float-market-cap weighted, which means that index weights reflect aggregate investor expectations. Exhibit 2 shows how the evolution of the largest five companies in the S&P 500 and its GICS® sector weights captured the increased importance of Information Technology companies, and the reduction in Industrials and Energy companies.
Not Just One Index – Ecosystems Matter!
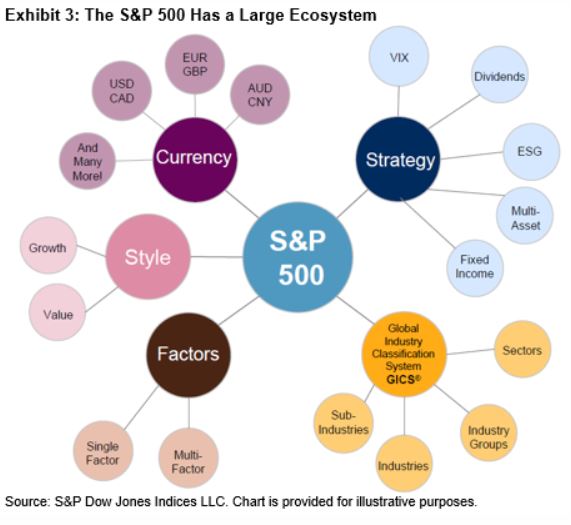
A sizeable ecosystem has grown up around the S&P 500. Exhibit 3 shows a range of indices based on the S&P 500. This is important because the liquidity associated with products tracking these indices can help foster transparency, market efficiency, and investor confidence.
Beating the S&P 500 Has Been Difficult
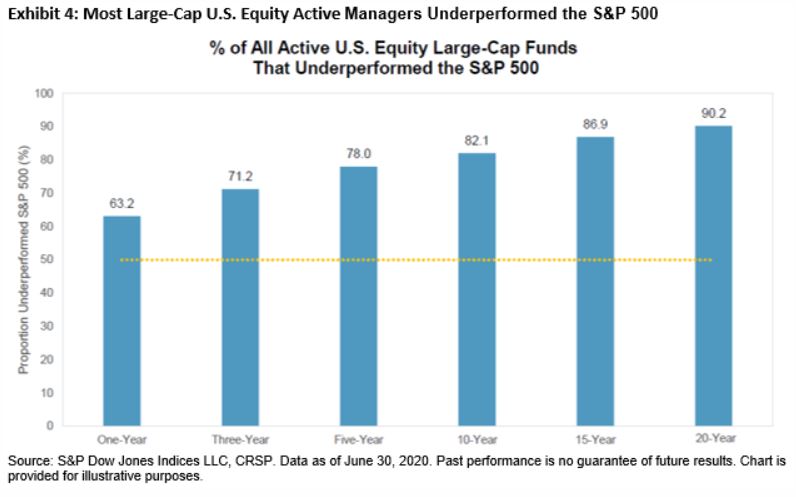
Over its history, it’s proven to be very difficult for active managers to beat the S&P 500. Our U.S. SPIVA Scorecards show that most U.S. large-cap active managers underperformed the S&P 500 in 16 of 19 calendar years between 2001 and 2019. And as of the end of June 2020, the majority of all large-cap U.S. equity managers underperformed the S&P 500 across all time horizons shown.
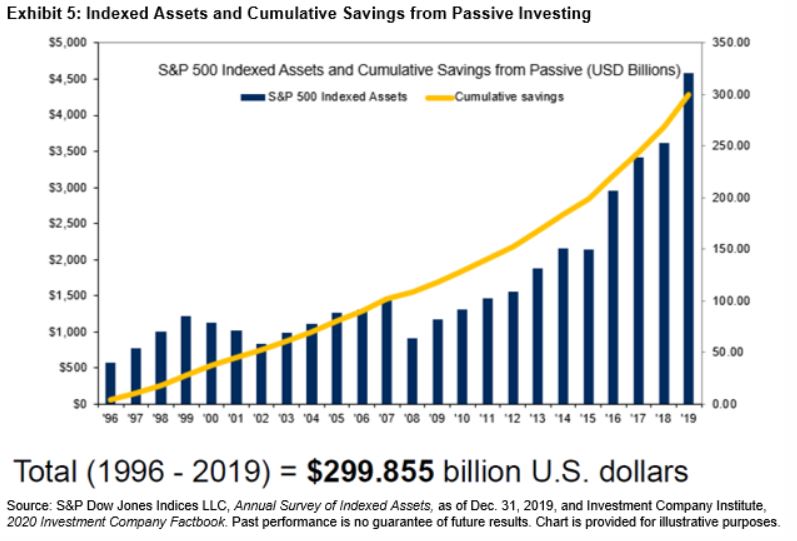
Although such underperformance is not specific to the U.S., and there are various explanations as to why beating benchmarks is difficult, increased awareness of the potential benefits of adopting an indexed-based approach has arguably had a bigger impact in U.S. large caps than in most other areas. Exhibit 4 shows that assets directly tracking the S&P 500 have grown substantially since 1996, reaching USD 4.59 trillion at the end of 2019. Multiplying the assets tracking the S&P 500 at the end of the year by the corresponding difference in average expense ratio between active funds and their passive alternatives shows that the estimated cumulative savings to investors from passively tracking the S&P 500 was USD 300 billion between 1996 and 2019.
The S&P 500’s construction, its historical performance, its large ecosystem, and its challenge to active managers all help to explain the index’s relevance and appeal. Here’s to another 64 years!
The posts on this blog are opinions, not advice. Please read our Disclaimers.
Content Type
Segment
Language
