Featured Topics
Featured Products
Events
S&P Global Offerings
Featured Topics
Featured Products
Events
S&P Global Offerings
Featured Topics
Featured Products
Events
S&P Global Offerings
Featured Topics
Featured Products
Events
Language
Featured Products
Ratings & Benchmarks
By Topic
Market Insights
About S&P Global
Corporate Responsibility
Culture & Engagement
Featured Products
Ratings & Benchmarks
By Topic
Market Insights
About S&P Global
Corporate Responsibility
Culture & Engagement
S&P Dow Jones Indices — 19 Mar, 2020
Investing in infrastructure has become popular among institutional and private investors in recent years. Investors could be attracted to the potentially long-term, low-risk, and inflation-linked profile that can come with infrastructure assets, and they may find that it is an alternative asset class that could provide new sources of return and diversification of risk.
Infrastructure assets provide essential services that are necessary for populations and economies to function, prosper, and grow. They include a variety of assets divided into five general sectors: transportation (e.g., toll roads, airports, seaports, and rail); energy (e.g., gas and electricity transmission, distribution, and generation); water (e.g., pipelines and treatment plants); communications (e.g., broadcast, satellite, and cable); and social (e.g., hospitals, schools, and prisons). Infrastructure assets operate in an environment of limited competition as a result of natural monopolies, government regulations, or concessions. The stylized economic characteristics of this asset class include the following:
Consequently, the infrastructure asset class may provide investors with a degree of protection from the business and economic cycles, as well as attractive income yields and an inflation hedge. It could be expected to offer long-term, low-risk, non-correlated, inflation-protected, and acyclical returns.
It is also generally believed that infrastructure is, as an asset class, poised for strong growth. As the global population continues to expand and standards of living around the world become higher, there is a vast demand for improved infrastructure. This demand includes the refurbishment and replacement of existing infrastructure worldwide and new infrastructure development in emerging markets.
Financing public infrastructure has traditionally been the responsibility of the state. However, fiscally constrained governments are increasingly turning to the private sector to provide funding for new projects. As a result, the investment opportunities in this sector continue to grow.
Exposure to infrastructure can be achieved either directly or indirectly.
Direct exposure is gained through private markets in which investors own the companies that build or operate the infrastructure assets, like toll roads, airports, etc. The most important benefit of investing through these vehicles is that market participants obtain the direct exposure they are looking for and all of the benefits that come with owning the infrastructure itself.
On the other hand, infrastructure assets are often highly regulated, so this type of investment can have more concentrated regulatory risk. It also often involves significant leverage, along with the risks that are bundled with it. The other potential downside is that these assets are illiquid, so there is no price transparency on an ongoing basis. Market participants would typically have to invest in the asset class for the long term, as there are no liquid secondary markets in which their investments could be quickly traded.
Indirect investment can be achieved through publicly listed companies whose business is directly related to infrastructure assets.
The primary advantage of listed infrastructure vehicles is that they are traded on an exchange. The size of the listed market is large—the total market capitalization of the universe of “pure-play” infrastructure companies, from which the Dow Jones Brookfield Global Infrastructure Index is constructed, was USD 1.76 trillion as of Dec. 31, 2019. Listed companies also provide access to unique assets that might only be available in public markets. Daily price transparency and relative liquidity, which are characteristics of listed companies, are important to many market participants. Listed firms also have extensive financial reporting requirements that are regulated by the various stock exchanges.
The primary disadvantage of this type of investment is that publicly traded stocks that make up the listed infrastructure vehicle may already be part of the investor’s equity portfolio. Another negative aspect of this type of infrastructure investment is that infrastructure assets are sometimes just one piece of a larger conglomerate’s operations, particularly on a global basis.
A number of new infrastructure indices (capturing only publicly listed infrastructure securities) have emerged since the mid-2000s. Most indices take one of two construction approaches: either applying a market-cap-weighting methodology to infrastructure sectors (in which case, utilities will always dominate the index) or imposing hard caps on these sectors. In order to identify effectively companies with the pure-play characteristics previously outlined, it is necessary to dig into financials and identify what percentage of earnings comes from competitively exposed versus regulated lines of business.
Managers in infrastructure investment may consider different benchmarks, depending on their own definition of the investment universe. Some managers favor pure-play infrastructure sectors, considering only stocks with stable cash flow patterns and low correlations to broader equities for portfolio inclusion. Other managers operate under a less-constrained definition of the space, with a thematic view of what constitutes infrastructure. Such portfolios may include infrastructure-related companies such as shipping, diversified communications, power generation, etc.
S&P Dow Jones Indices has been a leader in benchmarking the publicly listed infrastructure market. Two distinct approaches are provided to the different types of managers for benchmarking. The Dow Jones Brookfield Global Infrastructure Indices use a pure-play approach. Companies that obtain a majority (70% or higher) of their cash flows from owning and operating infrastructure assets are selected for the indices. On the other hand, the S&P Global Infrastructure Index Series uses a broad-based approach. Companies from infrastructure-related sectors, industries, and subindustries, as defined by the Global Industry Classification Standard (GICS®), are selected for the indices. Both series of indices could be appropriate for market participants seeking diversified, globally listed infrastructure exposure. Exhibit 1 shows a detailed comparison of the methodologies of two examples from the index series mentioned above. Exhibit 2 shows the sector weights of the two indices—the Dow Jones Brookfield Global Infrastructure Index and the S&P Global Infrastructure Index—as of Dec. 31, 2019.


Several other indices are offered by competitors (UBS, MSCI, Macquarie, and FTSE) in this space—the UBS Global 50/50 Infrastructure & Utilities Net of Tax Index (which has been retired), the MSCI ACWI Infrastructure Index, the Macquarie Global Infrastructure 100 Index (which was retired in November 2016), and the FTSE Global Core Infrastructure 50/50 Index. All of them rely on a broad-based approach that is similar to the S&P Global Infrastructure Index (see Exhibit 3).

The risk/return profile of the Dow Jones Brookfield Global Infrastructure Index, which takes a pure-play approach, is differentiated from that of an index taking a broad-based approach (as seen in Exhibit 4). The Dow Jones Brookfield Global Infrastructure Index has shown the highest return and risk-adjusted return over the past 10 years. The index has an annualized return of 10.22% over the past 10 years, outperforming the S&P Global BMI by 1.34% and all other infrastructure indices studied here by more than 3.45% per year.

In terms of downside protection and diversification benefits, the Dow Jones Brookfield Global Infrastructure Index, S&P Global Infrastructure Index, and MSCI ACWI Infrastructure Index showed the best statistics over the 10-year period. For these three indices, the maximum drawdowns were cut from 21.15% for the S&P Global BMI to 17.05%, 15.72%, 12.04% respectively; betas against the S&P Global BMI were below 0.9 over the past 10 years. On a rolling three-year basis, the Dow Jones Brookfield Global Infrastructure Index has shown continuous significant positive returns in excess of the S&P Global BMI; while the other infrastructure indices have experienced diminished outperformance since the global financial crisis in 2008 and 2009 (see Exhibit 5). On a rolling three-year basis, the Dow Jones Brookfield Global Infrastructure Index underperformed the S&P Global BMI from May 2015 to April 2016 and from January 2017 to December 2019, with two prolonged periods of oil price decline in the background.

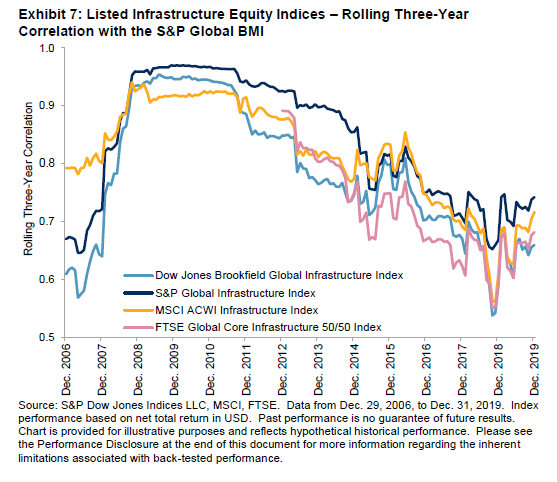
In terms of volatility and correlation, the S&P Global Infrastructure Index is on the high side of the spectrum (see Exhibits 6 and 7). This is consistent with the index’s construction idea. Of note, volatility and correlation have increased significantly since 2008. This phenomenon has been observed among all asset classes, making it challenging for market participants to construct a diversified portfolio during crisis periods. Fortunately, we saw volatility and correlation come down since the end of 2011, before increasing slightly in 2019.

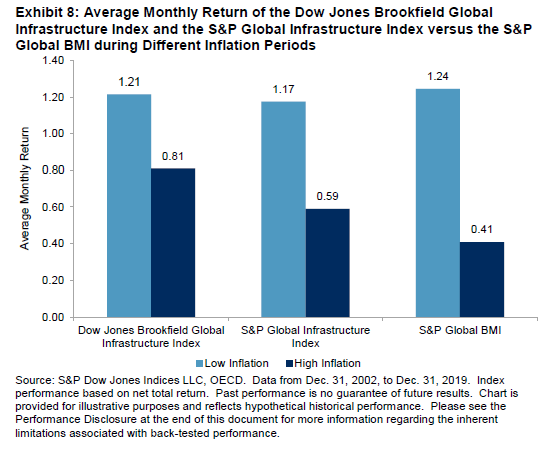
One of the potential benefits of investing in infrastructure is the historical inflation hedge that it has provided. To illustrate this, we studied the relationship between the indices’ monthly returns and inflation rates3 compared with the broad market benchmark. Exhibit 8 shows that over the past 17 years (from Dec. 31, 2002, to Dec. 31, 2019), the Dow Jones Brookfield Global Infrastructure Index and the S&P Global Infrastructure Index have outperformed the S&P Global BMI by a monthly average of 40 bps and 18 bps, respectively, in high-inflation months. These two indices have slightly underperformed the S&P Global BMI in low-inflation months.
The impact of oil prices on companies owning or operating infrastructure assets is not trivial. First, there is generally low exposure to oil prices, as companies that typically own or operate these assets tend to have stable cash flows backed by long-term contracts that are sometimes regulation enabled. It also helps that most of these assets are monopolistic in nature.
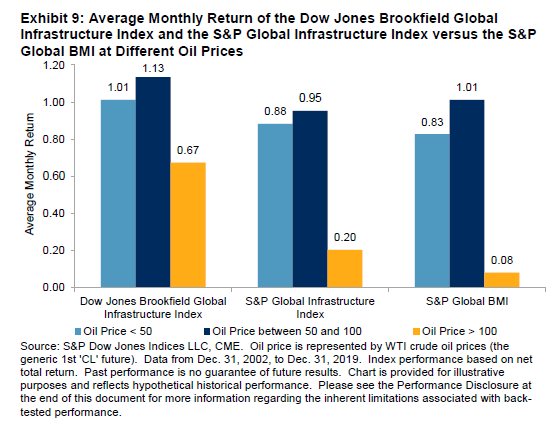
Second, there is no linear relationship between oil prices and performance of listed infrastructure. Exhibit 9 shows that from Dec. 31, 2002, to Dec. 31, 2019, the Dow Jones Brookfield Global Infrastructure Index and the S&P Global Infrastructure Index almost always outperformed the S&P Global BMI, regardless of oil prices. When oil prices were high (above USD 100 per barrel), the monthly outperformance was 59 bps and 12 bps on average, respectively. When oil prices were low (below USD 50 per barrel), the monthly outperformance was 19 bps and 6 bps on average, respectively. When oil prices were moderate (between USD 50 and USD 100 per barrel), the monthly outperformance was 12 bps for the Dow Jones Brookfield Global Infrastructure Index, and the S&P Global Infrastructure Index slightly underperformed on average. It seems that low oil prices may not be a bad thing for listed infrastructure.
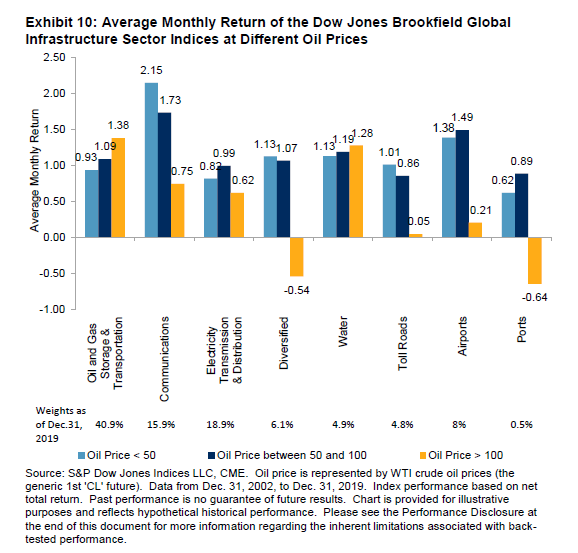
Third, the sensitivity to oil prices varies from company to company, depending on whether they are net consumers or producers of oil. Exhibit 10 shows the average monthly return of the Dow Jones Brookfield Global Infrastructure Sector Indices at different oil prices from Dec. 31, 2002, to Dec. 31, 2019. Oil & Gas Storage & Transportation seemed to be the infrastructure subsector most negatively affected by low oil prices. Other sectors, except Water, seemed to benefit from low oil prices.
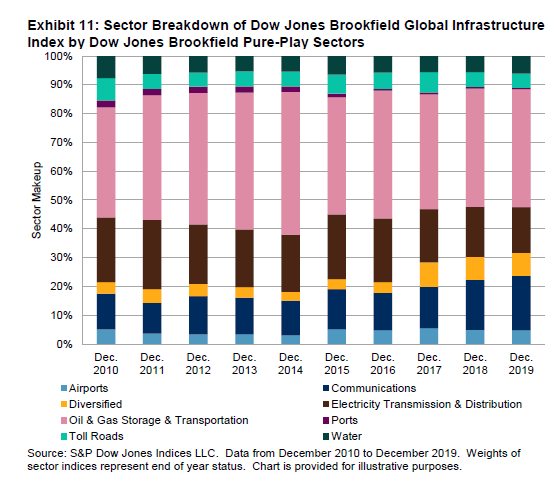
Among all eight Dow Jones Brookfield pure-play sectors, the Dow Jones Brookfield Global Infrastructure Index is most heavily exposed to Oil & Gas Storage & Transportation. As of Dec. 31, 2019, it took up 41% of the index and averaged 43.01% over the past 10 years (see Exhibit 11).
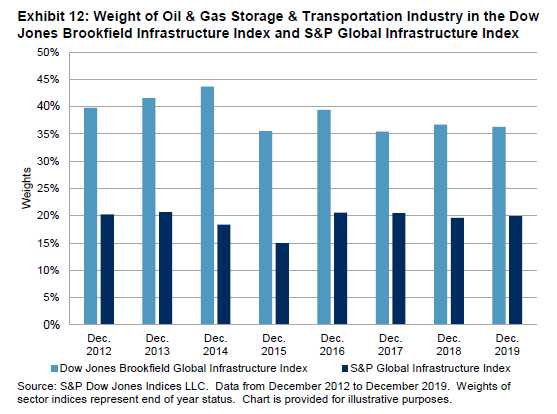
Companies in the Oil & Gas Storage & Transportation sector are defined as being engaged in the development, ownership, lease, concession, or management of oil and gas (and other bulk liquid products), fixed transportation or storage assets, and related midstream energy services. This pure-play infrastructure sector corresponds to a combination of two GICS sub-industries: Oil & Gas Storage & Transportation and Gas Utilities. Exhibit 12 shows that over the past eight years (GICS was not available for the Dow Jones Brookfield Indices before 2012), the Dow Jones Brookfield Global Infrastructure Index had allocated 19% more on average to Oil & Gas Storage & Transportation than the S&P Global Infrastructure Index. The difference is a natural result of unconstrained versus constrained index design. The Dow Jones Brookfield Global Infrastructure Index applies an unconstrained approach, while the S&P Global Infrastructure Index is capped at 20% for the Energy sector (Oil & Gas Storage & Transportation) and 40% for the Utilities sector (Gas Utilities; see Exhibit 1).
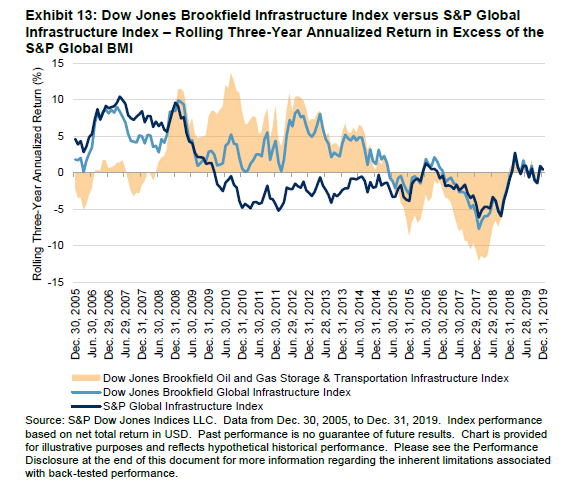
Given its substantial weight, Oil & Gas Storage & Transportation plays an important role in understanding the performance of the Dow Jones Brookfield Global Infrastructure Index. Exhibit 13 demonstrates the impact of Oil & Gas Storage & Transportation on the Dow Jones Brookfield Global Infrastructure Index in comparison with the S&P Global Infrastructure Index on a rolling three-year basis. There are two clear-cut intervals since the 2008 financial crisis. First, from January 2009 to mid 2015, the Dow Jones Brookfield Global Infrastructure Index presented a long-lasting outperformance over the S&P Global Infrastructure Index, which can be largely attributed to the rapid growth in Oil & Gas Storage & Transportation during this period. On the other hand, the Oil & Gas Storage & Transportation sector could also drag down the Dow Jones Brookfield Global Infrastructure Index when its performance is heavily suppressed; e.g., during the period from mid 2015 to late 2018, the Dow Jones Brookfield Global Infrastructure Index underperformed the S&P Global Infrastructure Index when Oil & Gas Storage & Transportation sector fell due to depressed oil prices or supply uncertainties.
Infrastructure could offer return, risk, and diversification characteristics that are different from those of other asset classes; thus, it may merit consideration for allocation in a diversified portfolio.
Exhibit 14 provides a detailed comparative overview of two infrastructure indices from S&P Dow Jones Indices versus a few major asset classes, including U.S. medium-term Treasury Bonds (as measured by the S&P U.S. Treasury Bond 7-10 Year Index4), U.S. investment-grade corporate bonds (as measured by the S&P U.S. Investment Grade Corporate Bond Index), U.S. high-yield corporate bonds (as measured by the S&P U.S. High Yield Corporate Bond Index), global leveraged loans (as measured by the S&P/LSTA U.S. Leveraged Loan 100 Index), and global equities (as measured by the S&P Global BMI). Exhibit 14 demonstrates that, over the past 10 years, the Dow Jones Brookfield Global Infrastructure Index outperformed all other asset classes in terms of absolute return. It also outperformed the S&P Global BMI in terms of the Sharpe, Sortino, and MAR ratios. The latter two of these ratios could be of interest to market participants who are more concerned about downside risk.
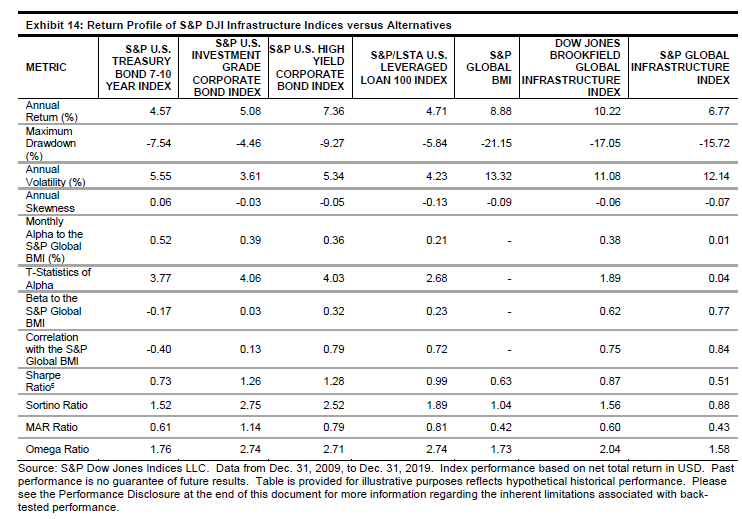
Exhibit 15 provides a visual illustration of the return versus the drawdown of the Dow Jones Brookfield Global Infrastructure Index, the S&P Global Infrastructure Index, and other asset classes. All index returns and drawdowns are leveraged to a 13.32% annual volatility level, which is the annual volatility of the S&P Global BMI’s net total returns over the past 10 years. For market participants who focus on return per unit of risk, it is worth noting that with the same downside risk, the Dow Jones Brookfield Global Infrastructure Index generated higher return than global equities from Dec. 31, 2009, to Dec. 31, 2019.
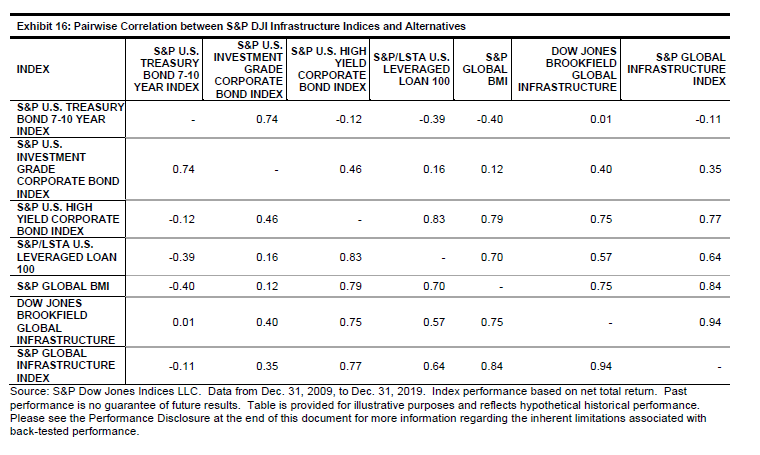
Diversification is the key advantage of infrastructure ownership in a portfolio context. Over the past 10 years, the Dow Jones Brookfield Global Infrastructure Index had a correlation of 0.01 with U.S. Treasury Bonds, 0.40 with U.S. investment-grade corporate bonds, 0.75 with U.S. high-yield bonds, 0.57 with global leveraged loans, and 0.75 with global equities (see Exhibit 16).

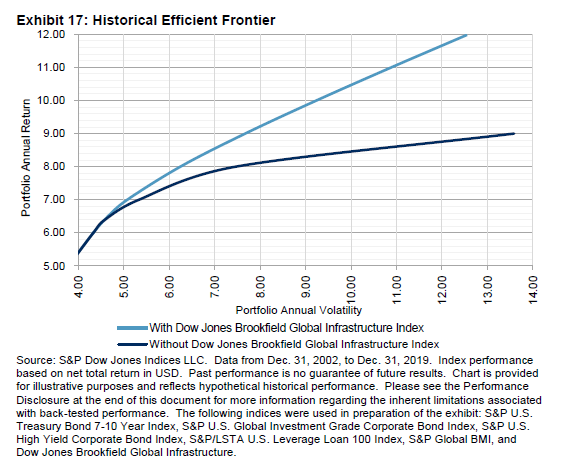
Finally, we performed two traditional Markowitz mean-variance optimizations, with and without the Dow Jones Brookfield Global Infrastructure Index included in the opportunity set of U.S. medium-term Treasury Bonds, investment-grade corporate bonds, high-yield corporate bonds, leveraged loans, and global equities. The resulting historical efficient frontiers are presented in Exhibit 17. There is a clear improvement in the efficiency of the resulting asset allocations after adding infrastructure into the opportunity set. The portfolio information ratio was maximized with an allocation of 50% to U.S. medium-term Treasury Bonds, 47% to U.S. high-yield corporate bonds, and 3.2% to the Dow Jones Brookfield Global Infrastructure Index.
Infrastructure is an asset class that has proven to be a strong source of diversification, yield, and attractive net total returns. Given the essential role of infrastructure assets as a backbone for economic growth, and in light of the growing trend of privatization of these assets, this sector is an emerging asset class in its own right. Unlike other listed infrastructure indices, the Dow Jones Brookfield Global Infrastructure Index and the S&P Global Infrastructure Index use a broad-based approach that identifies companies that fall into the pure-play infrastructure category. Listed infrastructure, in particular, may offer a sound anchor and immediate entry point into the asset class.
Content Type
Theme
Location
Language