Featured Topics
Featured Products
Events
S&P Global Offerings
Featured Topics
Featured Products
Events
S&P Global Offerings
Featured Topics
Featured Products
Events
S&P Global Offerings
Featured Topics
Featured Products
Events
Language
Featured Products
Ratings & Benchmarks
By Topic
Market Insights
About S&P Global
Corporate Responsibility
Culture & Engagement
Featured Products
Ratings & Benchmarks
By Topic
Market Insights
About S&P Global
Corporate Responsibility
Culture & Engagement
S&P Dow Jones Indices — 27 Oct, 2020
This article is reprinted from the Indexology blog of S&P Dow Jones Indices.
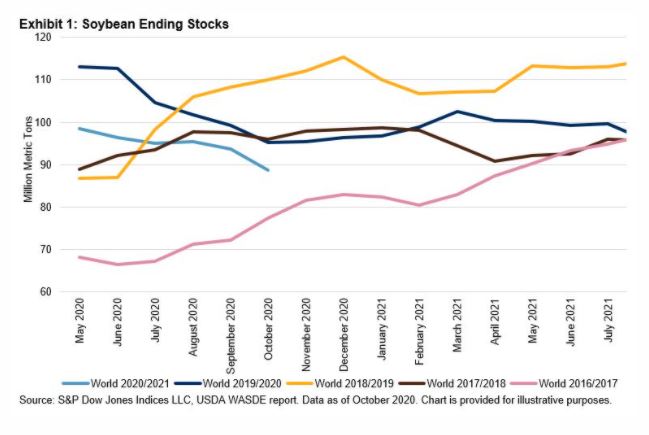
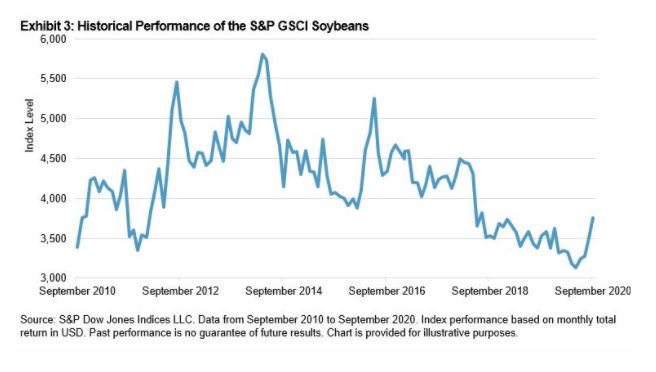
Only a few months ago, it seemed that global soybean supplies were more than ample, and in the case of the U.S., a semi-permanent soybean mountain had been built in the wake of damaged demand from its top customer, China. Fast forward to late October 2020, and the S&P GSCI Soybeans is up 29% since the low in March of this year, making a new high last week driven by abrupt supply cuts and the rapid return of export demand. Earlier this month, the USDA’s monthly World Agricultural Supply and Demand Estimates (WASDE) report forecast a large, and somewhat unexpected, reduction in global soybean stocks. Exhibit 1 illustrates global soybean ending stocks in the 2020-2021 crop year dropping in October 2020 to the lowest level in four years.

Brazil and the U.S. make up approximately 85% of total soybean exports, and there have been supply issues in both countries. There has been limited availability of exportable supplies in Brazil due to COVID-19, and now there is an increased possibility of South American supplies tightening in 2021, particularly if the current La Niña weather pattern leads to drier conditions in Brazil and Argentina. Similarly, in the U.S., dry conditions have negatively affected yields.
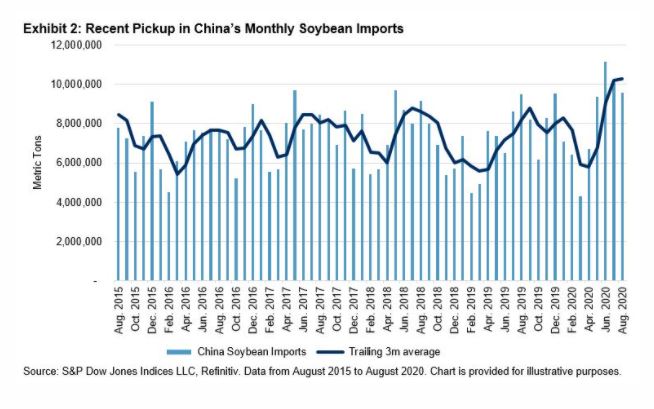
On the demand side of the ledger, China imports roughly 60% of total global soybean exports. The recovery of China’s pork industry from the African swine fever has spurred imports in 2020. Soybean meal is used as a source of feedstock in animal production. Chinese monthly imports of soybeans reached a new five-year high this Northern Hemisphere summer (see Exhibit 2).

According to the USDA, outstanding sales to China from the U.S. in mid-September 2020 totaled nearly 17.0 million metric tons, nearly equal to the record set in 2013. Total outstanding sales for all markets in mid-September 2020 were at a record 32.0 million metric tons, a three-fold increase compared with those in 2019. The 2018-2019 crop year coincided with the start of the China-U.S. trade war, which was the catalyst for U.S. soybean exports to plummet. Two years later, China’s commitment has rebounded substantially.
The S&P GSCI Soybeans is designed to provide investors with a reliable and publicly available benchmark for investment performance in the soybean market. S&P Dow Jones Indices offers different versions of this index to cater to the needs of market participants. These versions include enhanced roll yields, dynamic roll yields, covered calls, forwards, 2x leveraged, and currency and regional indices. Single-commodity indices can offer investors an efficient way to access the return streams of unique assets such as soybeans.

The posts on this blog are opinions, not advice. Please read our Disclaimers.