S&P Global Offerings
Featured Topics
Featured Products
Events
S&P Global Offerings
Featured Topics
Featured Products
Events
S&P Global Offerings
Featured Topics
Featured Products
Events
Solutions
Capabilities
Delivery Platforms
News & Research
Our Methodology
Methodology & Participation
Reference Tools
Featured Events
S&P Global
S&P Global Offerings
S&P Global
Research & Insights
Solutions
Capabilities
Delivery Platforms
News & Research
Our Methodology
Methodology & Participation
Reference Tools
Featured Events
S&P Global
S&P Global Offerings
S&P Global
Research & Insights
S&P Global Offerings
Featured Topics
Featured Products
Events
Support
14 Jan 2025 | 06:00 UTC
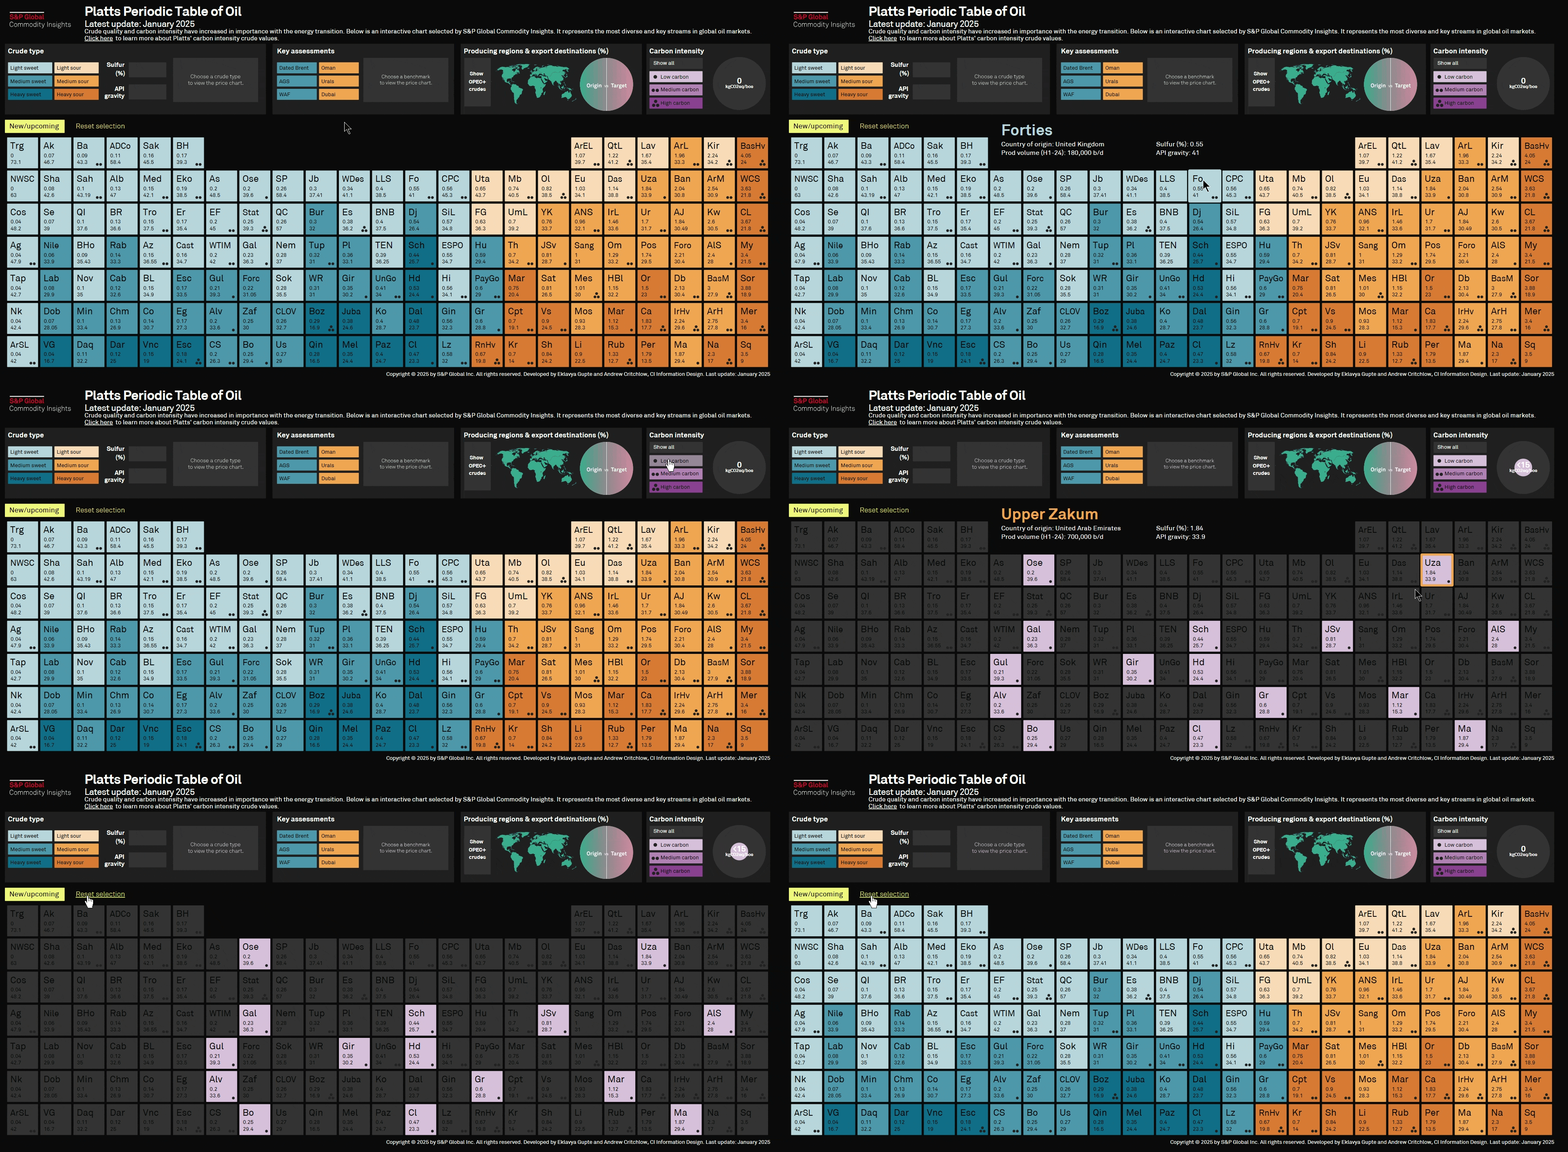
Click here to access the interactive Platts Periodic Table of Oil(opens in a new tab)
The latest update as of January 2025 includes:
The uneven pace of the global energy transition along with rising geopolitical tensions continue to impact every corner of the oil market.
With redirected oil flows, supply disruptions and a market increasingly under pressure from energy security concerns and demand destruction, the quality of oil has never been more important.
But with a growing focus on emissions reductions, producers are also looking to bring down the emissions intensity of their upstream operations. This table now also includes a special tab on carbon intensity.
S&P Global Commodity Insights now evaluates the carbon intensity of crude production for almost 100 oil fields. The results show a wide spectrum, from as low as 1.67 kg of carbon dioxide equivalent per barrel of production for Norway's Johan Sverdrup field, up to 527 kgCO2e/b for the Orinoco Belt in Venezuela.
There are hundreds of different grades and varieties produced around the world, from light sour Murban in the UAE to Guyana's medium sweet Liza and Mexican heavy-sour Maya crude.
This interactive chart allows readers to find key information on region of origin, price, trade volumes, sulfur content, viscosity, carbon intensity, trade flows and benchmarks in one place.
Click here to access the interactive Platts Periodic Table of Oil(opens in a new tab)

