Featured Topics
Featured Products
Events
S&P Global Offerings
Featured Topics
Featured Products
Events
S&P Global Offerings
Featured Topics
Featured Products
Events
S&P Global Offerings
Featured Topics
Featured Products
Events
Our Methodology
Methodology & Participation
Reference Tools
S&P Global
S&P Global Offerings
S&P Global
Our Methodology
Methodology & Participation
Reference Tools
S&P Global
S&P Global Offerings
S&P Global
May 20, 2022

By Yingzhi Zhang
The international trade of the seemingly endless supply of goods that enable globalization is entirely dependent on the physical transport of those goods. Despite ambitious ongoing climate goals by various organizations to push the industry towards Net Zero in the coming decades, the modern transportation industry is still heavily dependent on fossil fuels. This dependency in turn promotes additional international trade of the energy commodities that catalyze the global economy: bunkering and fuel oil.
Whether ocean freight or air freight, fuelling is essential to vessels and airplanes. In the case of serving vessels with foreign flags, the provision of such services are counted in the economy's foreign trade. Therefore, development in certain types of fuel oil could help analysts monitor the trade and traffic dynamics. As a downstream product of crude oil, the price of fuel is on one side is linked to crude oil market supply dynamics, and on the other side impacted by demand dynamics such as shipping and air freight. Further, emissions from the transport sector are directly impacted by the rates of fuel consumption, and therefore a key focus on the sustainability agenda.
While most of the discussions are around commodities and energy, impact from those headline topics is also observable with trade statistics. We present ways of using trade data to navigate the market potentials in relation to the fuel market, with some illustrations on perspectives including:
Trade and maritime data could help industry players to navigate the fuel market from several ways, whether directly or indirectly engaged in bunkering services and fuel supply. Analytics from fuel trade at very granular commodity identification levels and geographic patterns may help bunkering providers to identify market need and development. For transport sectors, airlines, shipping and logistics may track the upstream movement for cost implication and to increasingly source sustainable and alternative fuel supply. It also affords opportunities to corporates which are keen to pioneer in the sustainable initiative and supports their strategic decisions. On the operational level, looking for the exact HS code to report or prepare for port call bunkering operations are also helpful to trade agencies and port service in improving efficiency.
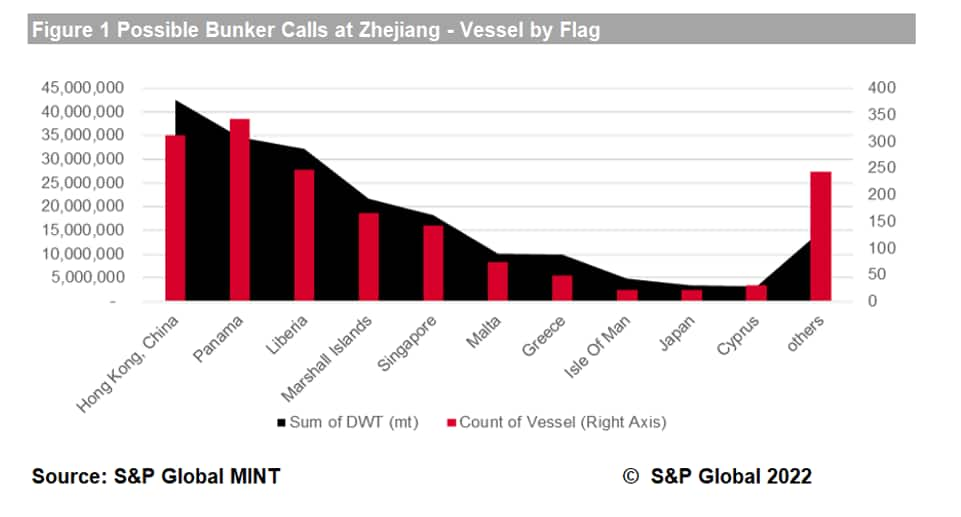
A few port-centric cities have evolved as marine bunkering hubs in global or regional shipping networks, such as Singapore, Belgium, Rotterdam and Zhoushan. The bunkering and fuel export activities of foreign-flagged ships are closely linked to the port callings and ship particulars. S&P Global Market Intelligence Network (MINT) tracks these possible bunkering calls, via a combination of terrestrial, vessel-based and satellite ship tracking technology. As of mid-May 2022, MINT reported a total of 1,646 vessels (sailing with flags other than People's Republic of China) are estimated to call at Zhejiang including Zhoushan Port, aggregating 98 million DWT. Of these, ships flying Hong Kong, China and Panama flags account for roughly 20% respectively in terms of vessel counts and total DWT; while Liberia, Marshall Island, Singapore, Malta are also among the top vessel flag states.
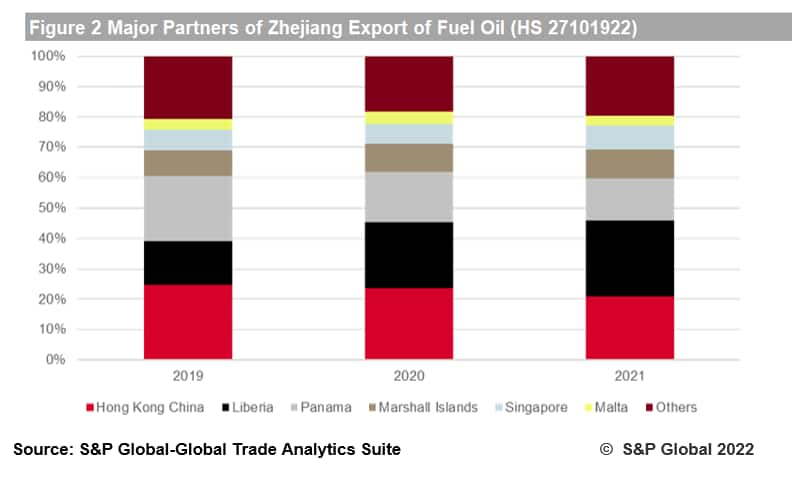
The distribution pattern is also reflected in the related fuel trade. Export data by S&P Global Global Trade Analytics Suite (GTAS) shows the ranking of trade partners of Zhejiang export of fuel oil coincides with the vessel flag states, i.e. Hong Kong China, Panama, Liberia, Mashal Islands, Singapore and Malta are among the top list, totalling over 80% of monthly export from Zhejiang were fuelled to vessels hanging these flags.
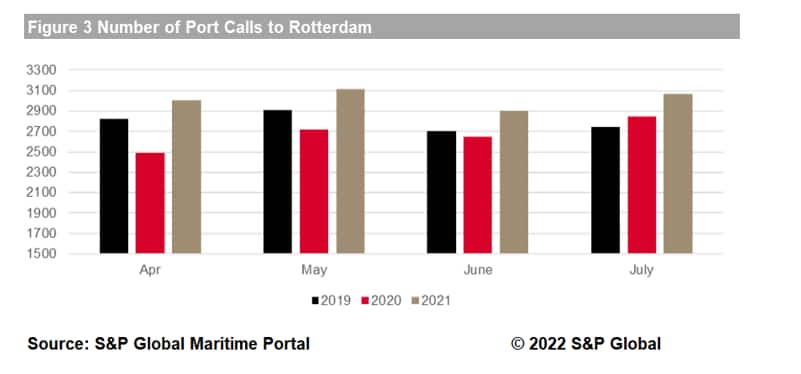
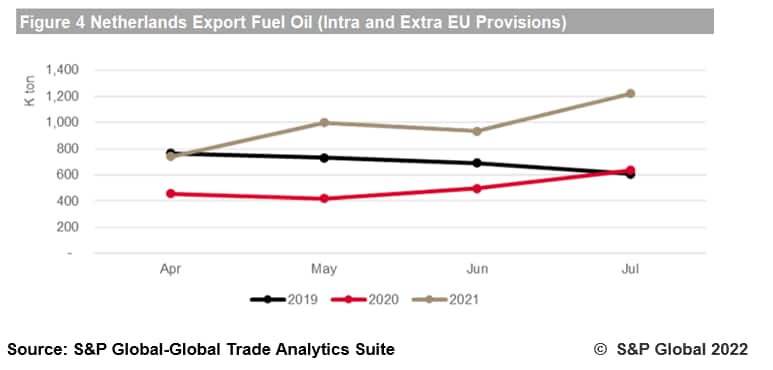
To some extent, fuel oil trade volume fluctuations are also related to the momentum of calling activities. Using the export of marine fuel data available from S&P Global GTAS, we can compare the marine fuel export from these key places together with the ship calling activities in the three most recent years, with the Covid-19 pandemic impact. Taking port call numbers to Rotterdam Port during Q2 in the past three years, we noticed April 2020 had a major drop when the first wave of the Covid-19 pandemic in Europe started disrupting. The trend of calling activities seems to have coincided with the export of fuel as for intra- and extra-EU provision from Netherlands, whereas April to June 2020 was much lower, before rebounding in July 2020.
A more indicative example is jet fuel and kerosene trade trends, reflecting the aviation sector challenges. While commodity flows usually reflect the 'trading' and upstream supply sides, air bunkering activities currently reflect the consumption and the momentum of flight activities and schedule frequency.
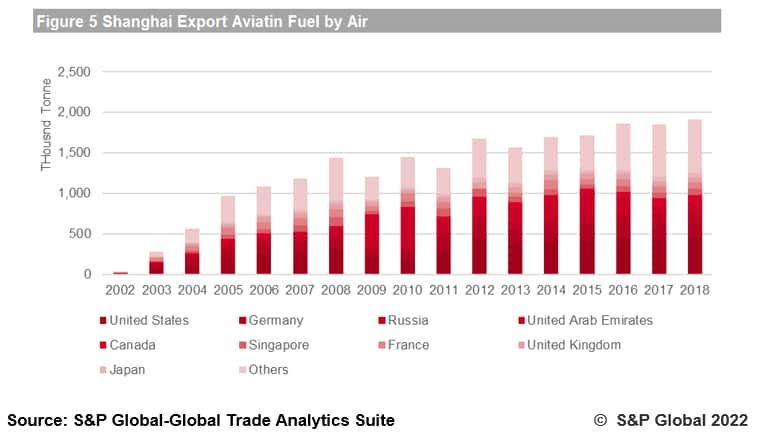
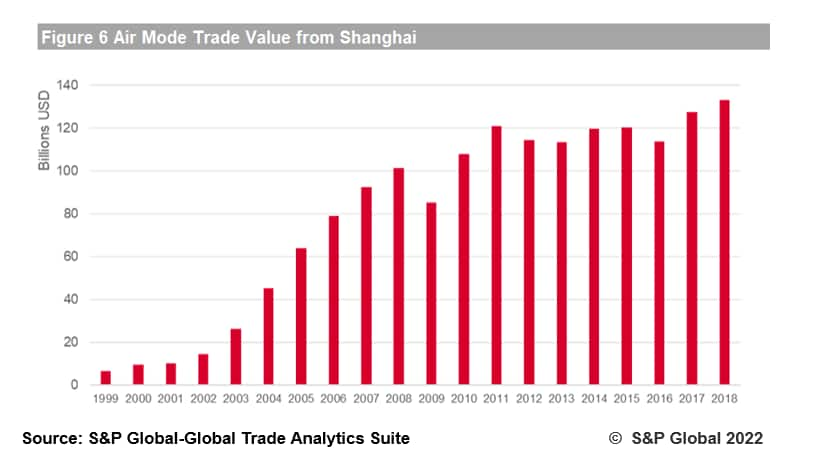
The momentum of international aviation activities could be observed from the jet fuel export. Shanghai ranks among the top 10 international air hubs. Since the debut of Pudong International Airport at the beginning of the 21st century, total export via air from Shanghai grew substantially from $10.38 billion in 2001 to $133 billion in 2018. Thus, it is not surprising to see aviation fuel from Shanghai exhibiting similar growth (and also supported by growing international passenger traffic in the corresponding decades).
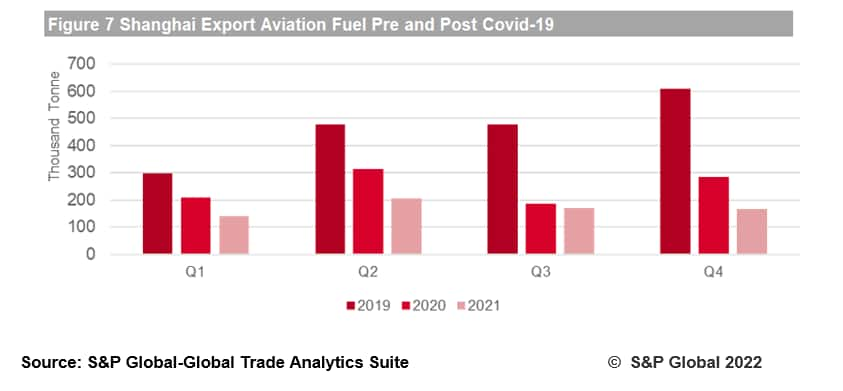
However, this momentum was paused since the outbreak of Covid-19. Comparing the recent three years' of aviation fuel export rates from Shanghai on a quarterly basis, the significant drop from Q4 2019 (609K tonnes) to Q4 2021 (166K Tonnes) reflects the challenges and the loss of flight connectivity from international origins and destinations.
Two of the leading bunkering hubs in Europe and Asia (i.e., Netherlands and Singapore) show observable unit prices of marine fuel oil moving in line with global crude oil prices. With reference to the bunker oil price index by S&P Global Energy Equipment and Service Price Forecast, the Q2 2020 index hit it's lowest point in recent years at 96.16 when world crude oil price cratered. Comparing the export data from GTAS reported by Singapore and Netherlands, the fuel oil export unit price was also low. The similar correlation could be observed for the increasing trend since 2021. What is worth pointing out is, since there could be numerous items under a HS chapter or definition, the more granularity and segmentation of commodity examined, the more clarity is possible.

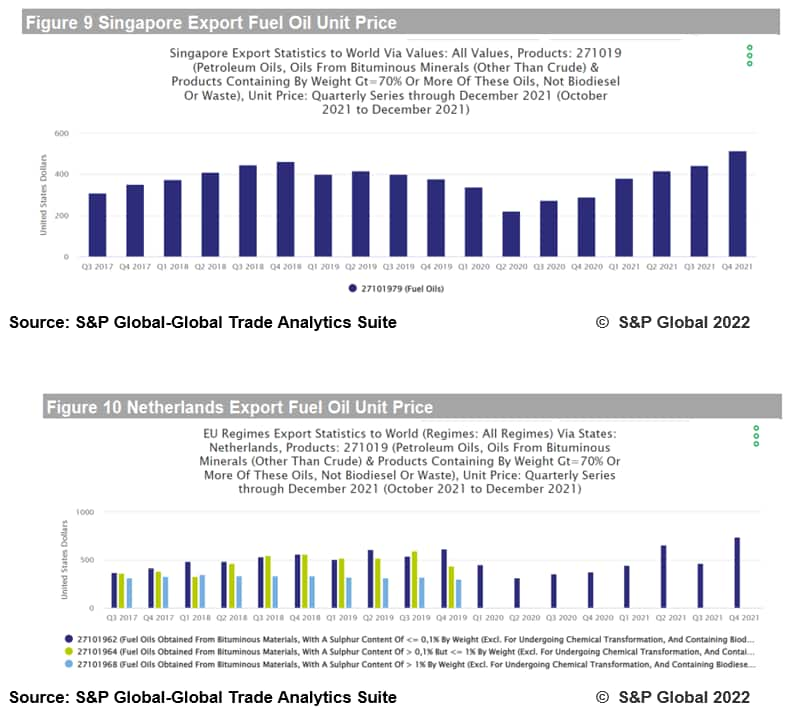
The in-tandem movement is reflecting global trends. GTAS data could be indicative for price monitoring especially where specific commodities are identifiable at a granular HS code level. For industry players who do not require very timely, high-frequency updates, but are still concerned with general shipping and freight trends, looking at the exact commodity macro trade data is also informative for them to track the price movement.
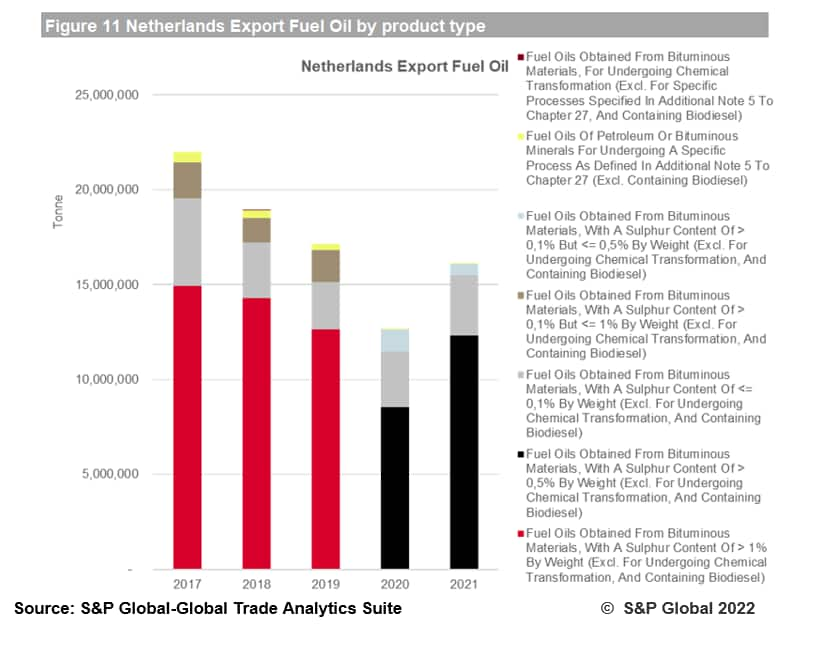
IMO 2020 implementation was evident in fuel oil trade reporting patterns. At the tariff-line level, individual reporters have their own definition or differentiation granularity in terms of fuel oil. For example, the EU members report granular HS codes identifying the sulphur content of various traded fuel oils, enabling analysis of emerging fuel types such as low-sulphur fuel. Netherlands was the bunkering hub prior to 2020, with majority of its export trade for 'fuel oil obtained from Bituminous materials, with a Sulphur Content >1%". However, post 2020, no trade is recorded for this line-item, rather, the volume is now moving to 'fuel oil obtained from Bituminous materials, with a sulphur content of 0.5%'. This demonstrates clearly that trade reporting is in line with the regulatory measure, and it is reasonable to perceive that the drop of a certain commodity's trade is now substituted by another to maintain overall consistent trade rates.
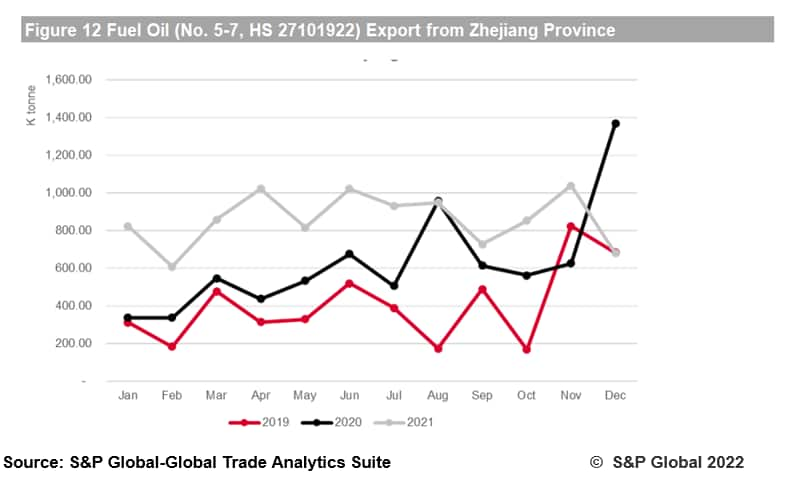
Taking another example, mainland China reported such fuel under HS 27101922 since the start of year 2020 to accommodate the new requirement and distinguish different fuel oil types, with monthly exports from Zhejiang (where Zhoushan port as a bunkering hub sits) tripling compared to 2019.
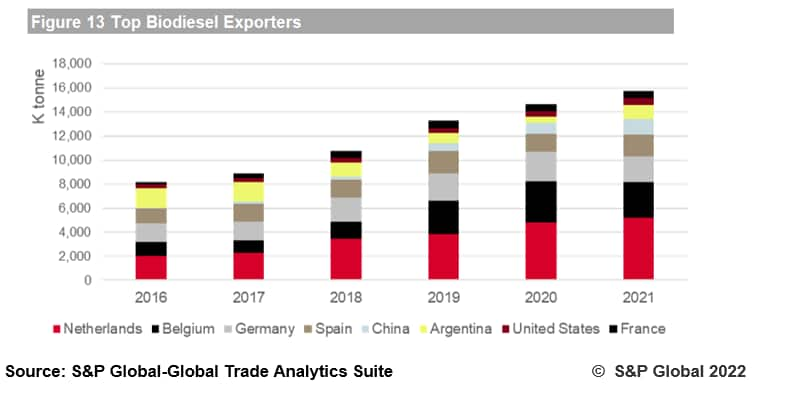
The sustainability agenda is progressively enjoying increasingly more awareness and action from global organizations. Though the absolute usage is still quite insignificant, we are seeing emerging commitment in such actions, by corporates as a component of formal ESG initiatives and related targets, including airlines. The IATA's initiative on sustainable aviation fuel, with biofuel a named component. As we noted from the analysis, all the fuel products under HS chapter 27 are specified that 'excluding bio-fuel'. The commodity classification for biofuel is reserved for HS chapter 38, possibly owing to the component nature of biofuel "These resources include Corn grain, Oil seeds, Algae, Other fats, oils, and greases, Agricultural residues".
There could be several biofuel products that may fall under different codes. The EU reports that mainland China and Argentina are large exporters of biodiesel HS 382600, for example. While conventional fuel oil is mostly derived from crude oil, the trade landscape could reshape as agriculture outputs become a major source of bio-fuels.
The solutions utilized in this analysis include the following.
Global Trade Analytics Suite (GTAS)
https://ihsmarkit.com/products/maritime-global-trade-analytics-suite.html S&P Global Global Trade Analytics Suite (GTAS) is the most comprehensive, intuitive, and powerful trade research tool on the market. Our suite of trade products delivers decision ready intelligence through analytics that have been built to evaluate global trade, commodity values, and identify companies involved in trade activity.
The GTAS platform combines three longstanding and established trade products: Global Trade Atlas macro trade statistics; PIERS Bill of Lading data, and GTAS Forecasting. Our clients can easily crosswalk between trade data sets to derive deep insights into trade activity. Users of all types and sophistication levels can decide to use our analytics, interrogate data within our UI, or extract data into .csv or excel.
Market Intelligence Network (MINT)
https://ihsmarkit.com/products/maritime-ship-tracker-market-intelligence-network.html
MINT gives traders the unique advantage by illustrating and quantifying commodity movements in real-time. Traders, analysts and charterers can immediately identify opportunities and monitor competitor/customer activities to improve trading results. Purchase MINT today to:
Subscribe to our monthly newsletter and stay up-to-date with our latest analytics
Posted 20 May 2022 by Yingzhi Zhang, Subject Matter Expert, Maritime,Trade & Supply Chain, S&P Global Market Intelligence
This article was published by S&P Global Market Intelligence and not by S&P Global Ratings, which is a separately managed division of S&P Global.