S&P Global Offerings
Featured Topics
Featured Products
Events
S&P Global Offerings
Featured Topics
Featured Products
Events
S&P Global Offerings
Featured Topics
Featured Products
Events
Solutions
Capabilities
Delivery Platforms
News & Research
Our Methodology
Methodology & Participation
Reference Tools
Featured Events
S&P Global
S&P Global Offerings
S&P Global
Research & Insights
Solutions
Capabilities
Delivery Platforms
News & Research
Our Methodology
Methodology & Participation
Reference Tools
Featured Events
S&P Global
S&P Global Offerings
S&P Global
Research & Insights
S&P Global Offerings
Featured Topics
Featured Products
Events
Support
Aug 30, 2024
The oil industry in Nigeria dates back to the 1930s, with Shell making the first oil discovery in 1956. Nigeria is a mature oil producing country and among Africa's largest oil producers. It also boasts the largest proven gas reserves on the continent. Approximately 60% of its output derived from offshore assets predominantly managed by major international oil companies (IOCs).
Crude oil production from offshore assets peaked at 1.9 million barrels of oil equivalent per day (MMboe/d) around 2010-2012 but has since declined due to a myriad of issues, primarily sabotage and oil theft. However, production has stabilized at 1.2 MMboe/d averaged over last three years. There have been a series of reforms introduced by the Nigerian government for the broader economy such as the removal of fuel subsidies as well as oil sector-specific reforms such as the introduction of a new fiscal regime for marginal assets and incentives for gas monetization. Reforms in the oil and gas industry are critical since the Nigerian economy is heavily reliant on this sector. The petroleum industry contributes around 10% to the country's GDP, while accounting for about 65-70% of government revenues and over 85% of its export earnings[1].
To understand ongoing trends such as divestments by IOCs and potential opportunities aligned with the government's focus on gas commercialization, it is important to consider the greenhouse gas (GHG) emissions of Nigeria's oil and gas production. Detailed, field-level emissions data enable a range of industry players to make informed decisions. For instance, financial institutions can set loan terms based on carbon intensity, oilfield services can implement decarbonization projects, and international organizations can develop policies and engage with local governments. Thus, the utility of the GHG data and insights is not just limited to energy companies.
The GHG intensity of oil and gas production in Nigeria and the Scope 1 emissions profiles of all producing offshore projects were analyzed using data from Vantage(opens in a new tab), a product of S&P Global Commodity Insights. The GHG emissions considered include CO2, methane (CH4) and nitrous oxide (N2O), originating from direct sources such as fuel gas and diesel combustion, flaring, and venting emissions. For this analysis, oil and gas projects across offshore Nigeria were consolidated into 61 main assets. The study primarily focused on two types of terrain — shelf and deep water, and also categorized by operator type: IOC, indigenous and national oil company (NOC).
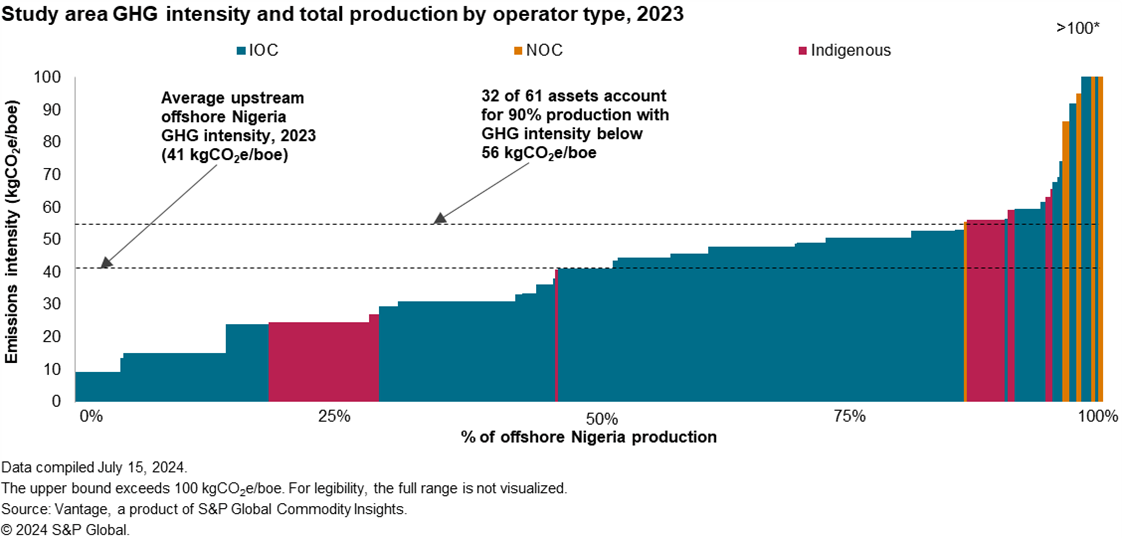
The overall production weighted average GHG emissions intensity of offshore Nigeria was 41 kgCO2e/boe, with asset-level emissions intensity varying significantly, ranging from 9 kgCO2e/boe to 107 kgCO2e/boe for the fields accounting for 99% of production. Notably, 32 out of the 61 assets had emissions intensity lower than 56 kgCO2e/boe while accounting for 90% of the total production.

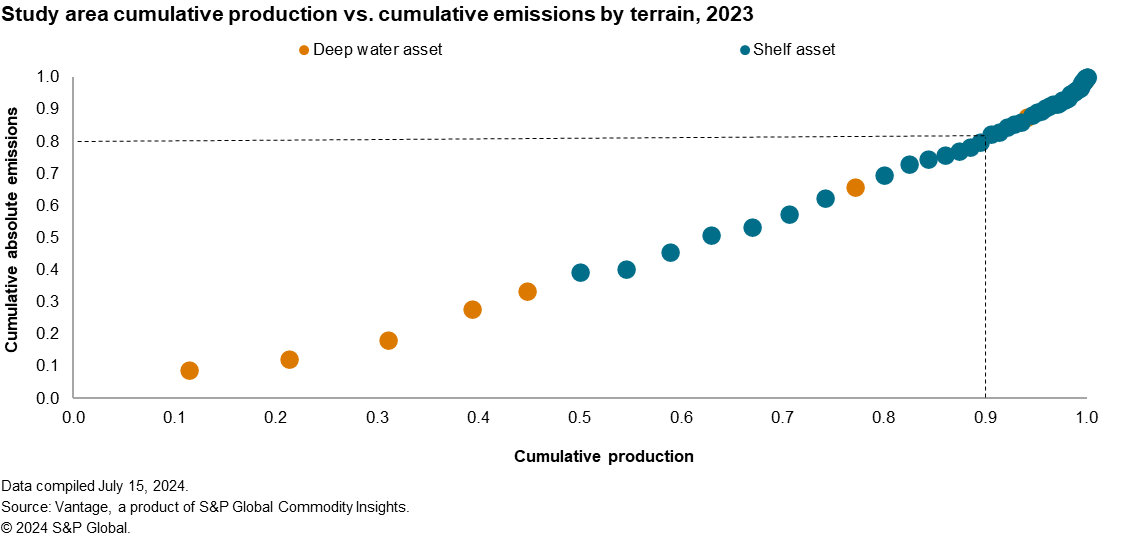
When the contribution of an asset to the total absolute emissions was plotted against its share of the total production volume cumulatively, a linear trend was observed. The largest 20 assets by production contributed to 90% of production and 80% of emissions, a pattern similar to that seen in offshore Brazil(opens in a new tab). Out of the 61 assets evaluated, 10 were operated by indigenous companies, 12 by the NOC, and 39 by IOCs. By terrain, 53 assets were on the shelf, while eight were in deep waters. Among the top-20 producing assets, IOCs operated 18, and seven of the eight deepwater assets were in this top-20 group. Emissions intensity of deepwater assets (33 kgCO2e/boe) was lower than that of the assets on the shelf (48 kgCO2e/boe), which is expected as the larger assets are concentrated in deepwater terrain. IOCs accounted for 82% of total production, with emissions intensity of 39 kgCO2e/boe, which is close to the region's average. GHG intensity for assets operated by indigenous companies was 37 kgCO2e/boe, and 113 kgCO2e/boe for the NOC. This is quite unique as the emissions intensity of assets operated by IOCs is not better than the average, suggesting a huge opportunity for improvement by implementing certain operational procedures as well as detection and measurement technologies to abate emissions. However, there are green shoots as IOCs have started to implement best operational practices to end routine flaring and advanced technologies such as drone-based detecting techniques to curb emissions and capture value. A few excellent decarbonization projects have begun to emerge, such as the flare-out of the Ofon field by TotalEnergies, which includes adding low-pressure compressors to reroute gas to market instead of flaring. IOCs have committed to initiatives like Zero Routine Flaring by 2030, which should result in a lowering of emissions intensity of production by IOCs in the next few years.

It is well acknowledged that oil and gas production in Nigeria is associated with high flaring intensity. However, the government is trying hard to commercialize the gas resource wasted through flaring and venting emissions. There have been fiscal incentives as well as special initiatives like Nigerian Gas Flare Commercialization Program (NGFCP). This opportunity to valorize the wasted hydrocarbons will be accompanied by three baskets of strategies — development of pipelines and gas gathering projects, implementation of decarbonization technologies to abate emissions with enhanced focus on methane and the divestment of high emissions projects.
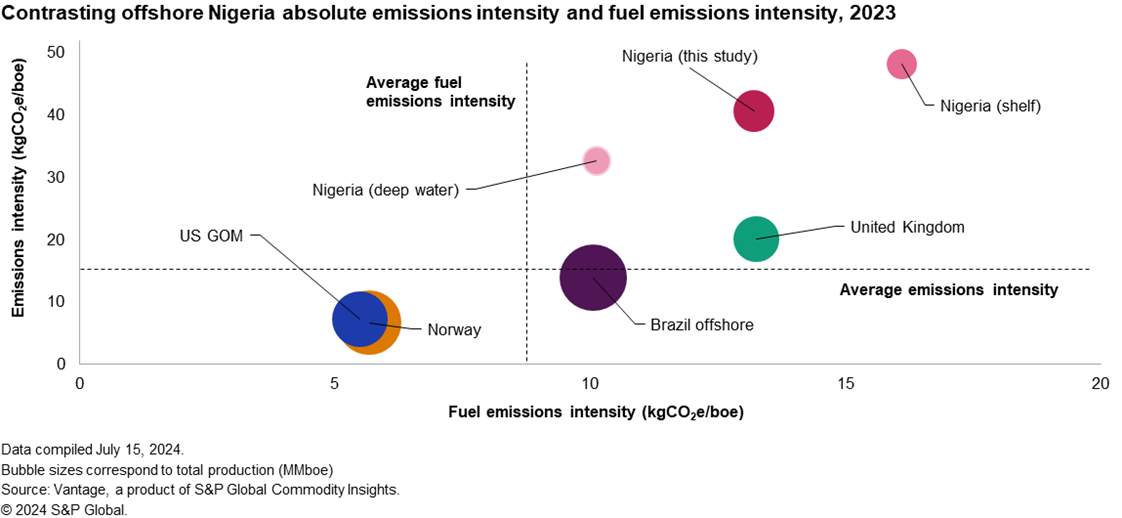
It was interesting to analyze the absolute emissions intensity versus the fuel emissions intensity for Nigeria and to compare them with other regions. Further analysis was conducted to distinguish between shelf and deepwater assets in Nigeria and is showcased in the graph below with different shades of pink colors. This comparison elucidates the low capital-cost opportunities available based on the segmented emissions data by source-type that have the potential to reduce emissions and capture value.
As mentioned earlier, absolute emissions include four different sources — emissions from the combustion of fuel gas and diesel, flaring and venting. Emissions reduction potential from fuel gas usage is only incremental as it is primarily for operational energy needs and may require high capital investments like electrification. However, significant savings in emissions from the latter three categories can be achieved with an emphasis on digitalization, leak detection and fixing and the deployment of proven technologies like vapor recovering units and blowdown capture systems. These saved gas volumes can either be sold in the domestic market or exported as LNG. It is important to note that Nigeria should not be directly compared with regions such as Norway(opens in a new tab) and the US Gulf of Mexico (GOM)(opens in a new tab), which have among the most stringent regulatory protocols, in addition to initiatives like power from shore(opens in a new tab). The fuel emissions intensity of Nigeria (13 kgCO2e/boe) is similar to that of the UK and not far off from Brazil (10 kgCO2e/boe). However, the overall emissions intensity for Nigeria is almost twice that of the UK and three times that of Brazil offshore, highlighting the scope for improvement. This discrepancy — assets in the top-right quadrant of the graph below — presents an opportunity to not only capture additional export revenues by deploying a combined strategy of development and decarbonization but also enhance the carbon competitiveness of Nigeria's oil and gas resources compared to other regions. In a hypothetical scenario where offshore Nigeria assets reduced their flaring emissions intensity to the levels of the UK; this would result in additional revenues of over $220 million each year at gas prices in the domestic market [2].
To conclude, higher emissions represent a low-hanging fruit and a significant opportunity for the country and industry players to increase the commercialization of gas and enhance the sustainability profile of Nigeria's oil and gas sector. Nigeria is at a critical juncture where it has implemented a range of progressive policies to increase its production, but the effective execution of these initiatives on the ground is crucial. Successful implementation will not only mobilize investments but also instill confidence in industry players and financial institutions. On the demand side, regulatory requirements may pose risks to market access. These include the imminent EU methane tax on fossil fuel imports and initiatives such as the Coalition for LNG Emission Abatement toward Net-zero (CLEAN), launched by Japanese and South Korean companies, to reduce methane emissions through the LNG value chain. This, in turn, will pave the way for improved longevity of revenues and reduced regulatory risks from the major export markets for the country's energy sector.

Commodity Insights' comprehensive and rapidly evolving GHG modeling capabilities enabled analysis of the Scope 1 emissions profiles of all major producing assets offshore Nigeria in 2023, providing timely insight into the GHG intensity of one of the world's most significant regions for oil and gas production. This insight is part of a continuing series of analyses from Commodity Insights' upstream GHG dataset. Find out more about our emissions capabilities here(opens in a new tab).
[1] Nigeria Executive Country Summary - https://geps.ci.ihsmarkit.com/GEPS/Display/58784a8f-95ff-4deb-8290-106baf150986
[2] Assuming Nigeria domestic gas price is $3.63/Mscf.
This article was published by S&P Global Commodity Insights and not by S&P Global Ratings, which is a separately managed division of S&P Global.
