Featured Topics
Featured Products
Events
S&P Global Offerings
Featured Topics
Featured Products
Events
S&P Global Offerings
Featured Topics
Featured Products
Events
S&P Global Offerings
Featured Topics
Featured Products
Events
Our Methodology
Methodology & Participation
Reference Tools
S&P Global
S&P Global Offerings
S&P Global
Our Methodology
Methodology & Participation
Reference Tools
S&P Global
S&P Global Offerings
S&P Global
Apr 21, 2022

By Mr. Hughes Paul
US Consumer Price Index (CPI), the broadest measure of inflation at the consumer level, reached 8.5% in March, the highest level since 1981. This stands in stark contrast to the inflationary environment that existed less than two years ago. In Q2 2020, when the US was in lockdown, the US CPI average was 0.4%. At that point, the concern was deflation triggered by measures to mitigate the spread of the COVID-19 virus. US Food CPI had not mirrored the overall CPI through 2020 and early 2021. However, in recent months, they have moved in lockstep with one another. US Food CPI was up 8.8% in March. Some forces are identical to those driving overall price levels, and some are unique to food and ag commodities. Nonetheless, consumers now see their buying power eroded faster than in more than a generation. Rapidly rising overall and food inflation is not unique to the US. On the other side of the Atlantic, the story is similar, albeit not so stark. Eurozone March consumer prices were up 7.5% and food prices up 5.0%. This compares to negative inflation levels for overall inflation at the end of 2020, and food inflation below 1% in mid-2021. 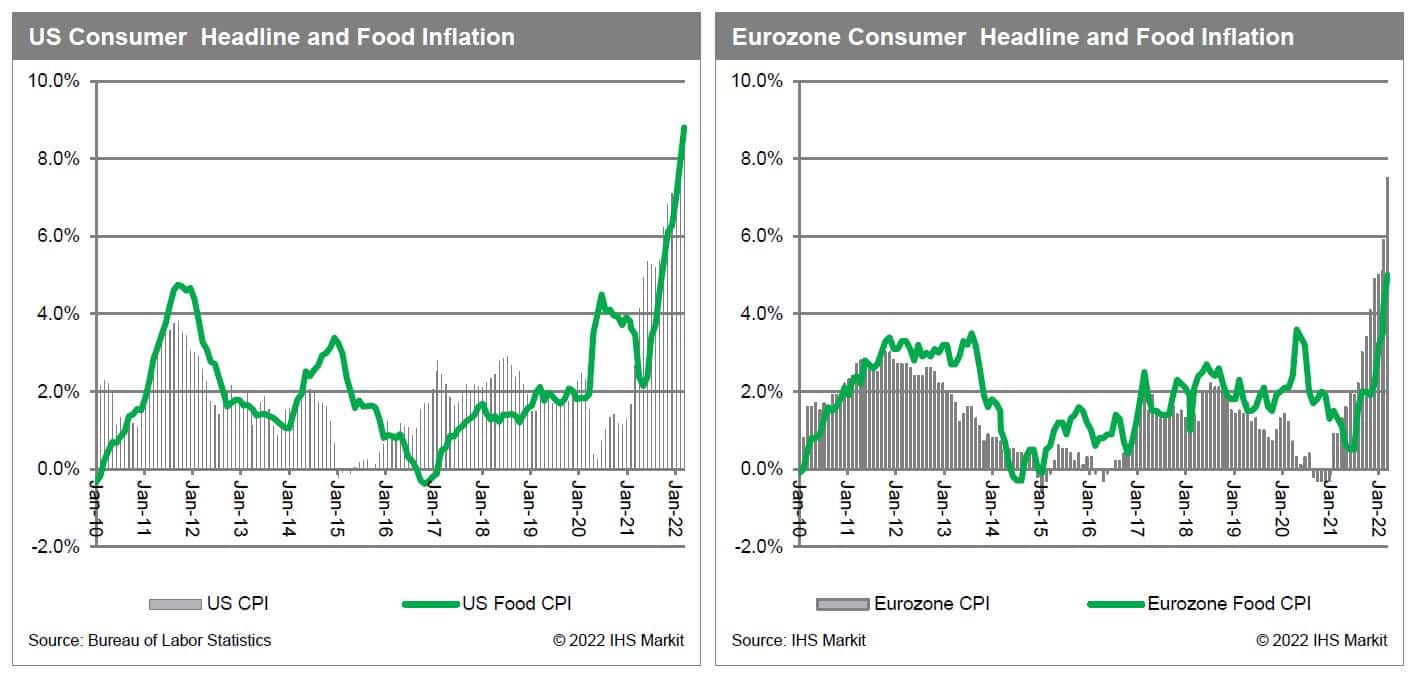
The United Nations' Food and Agricultural Organization (FAO) produces a widely watched food price index similar to the US CPI. However, it attempts to measure raw food price changes around the world. The index rose to record levels in March, rising 12.6% from February, the largest one-month increase on record dating back to 1991. The index points to a whopping 33.6% year-over-year increase and up nearly 75% since the 2020-low (May 2020). 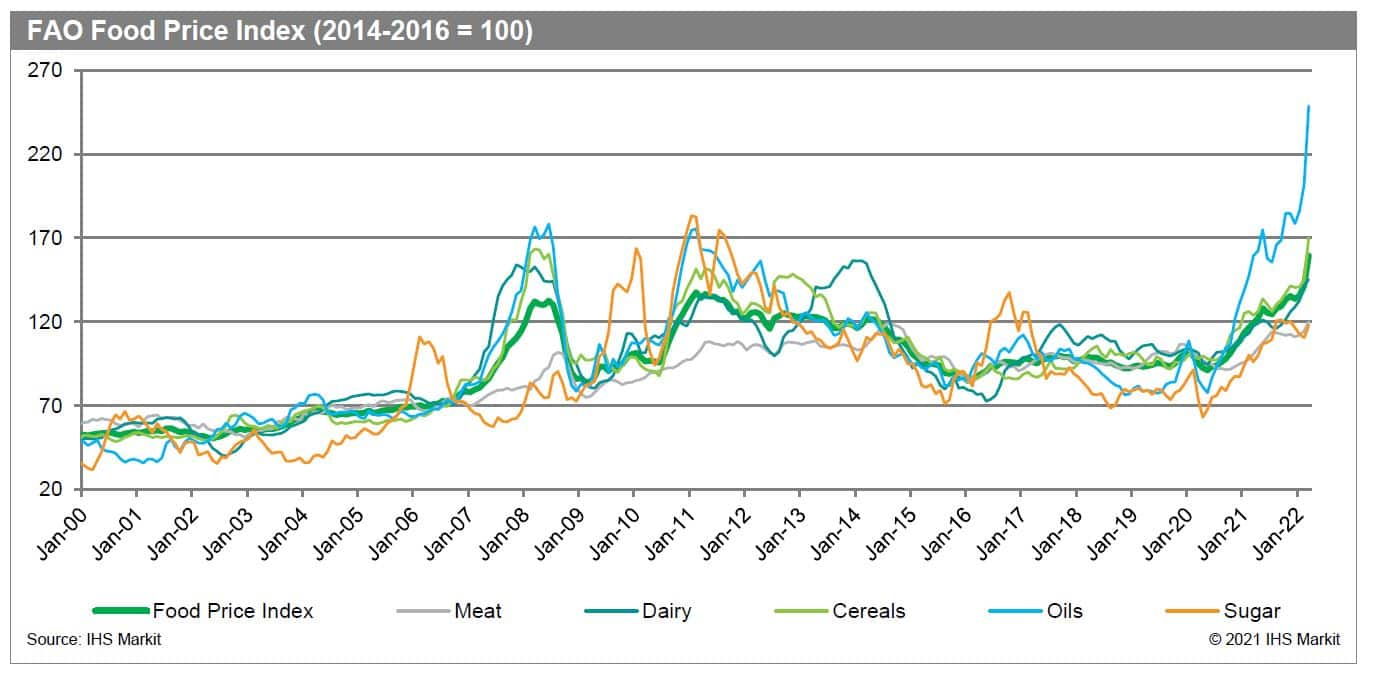 The FAO Food Price Index shows inflation is most acute in cooking oils, up 56% year-over-year and 220% from May 2020. Global meat prices are the most subdued, up 19% year-over-year and 26% since May 2020.
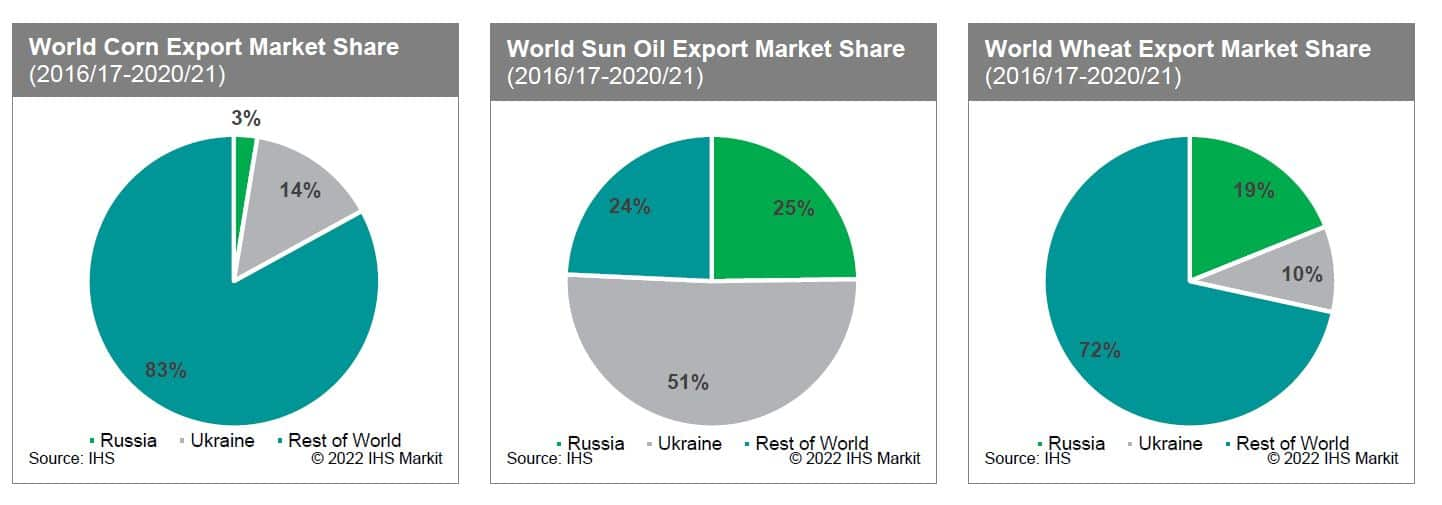
The road leading to this food and ag commodity inflation level has been a long and winding one with many unrelated factors since mid-2020. No doubt, the list below is not an exhaustive one. However, we have attempted to include many elements that converged to where we are today.
Exchange-traded ag commodities have outperformed equities. Since January 2020, the Bloomberg Ag Commodity Index has gained 85%, while the S & P 500 Index has gained 36%. In the near term, the contrast is even starker; ag commodities have gained 46%, while equities have gained only 7% in the past year. 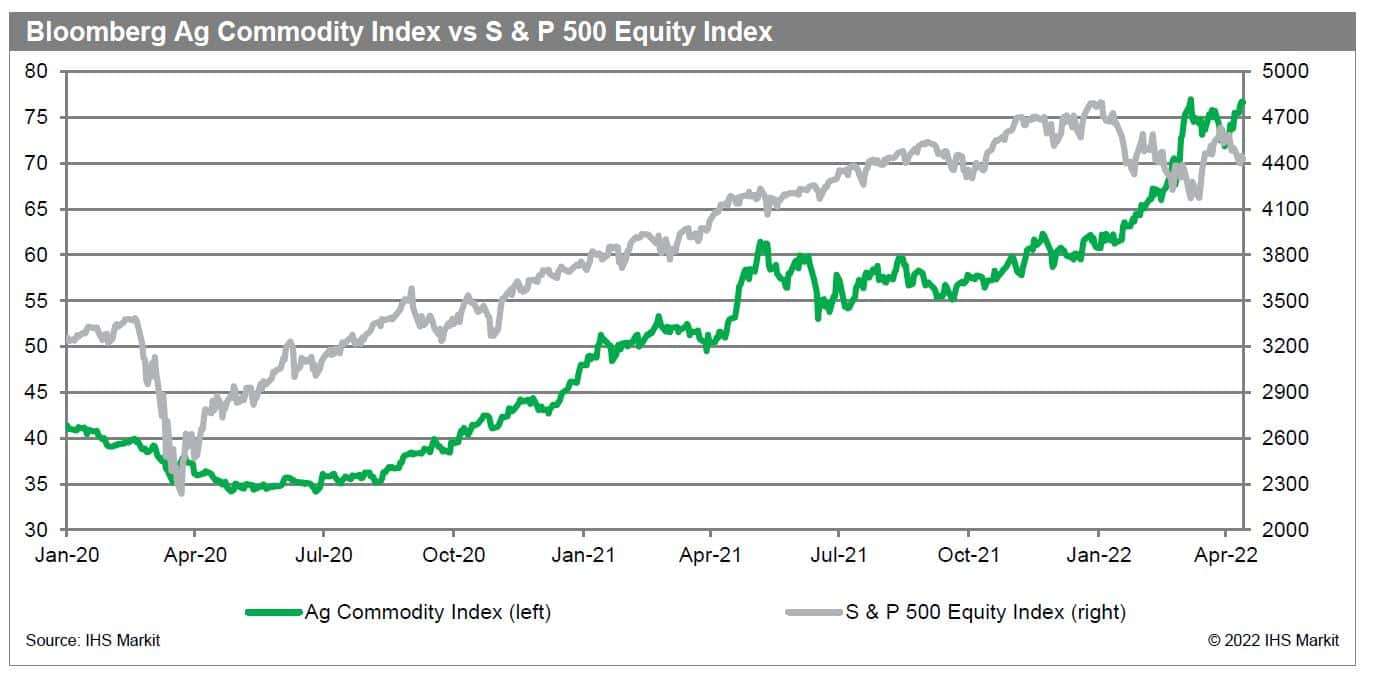 This has caught the attention of money managers, causing them to increase their asset allocation to commodities, including ag commodities. This week's total asset allocation by Managed Money was at a record $52 billion, as defined by the US regulator of commodity markets, the CFTC.
 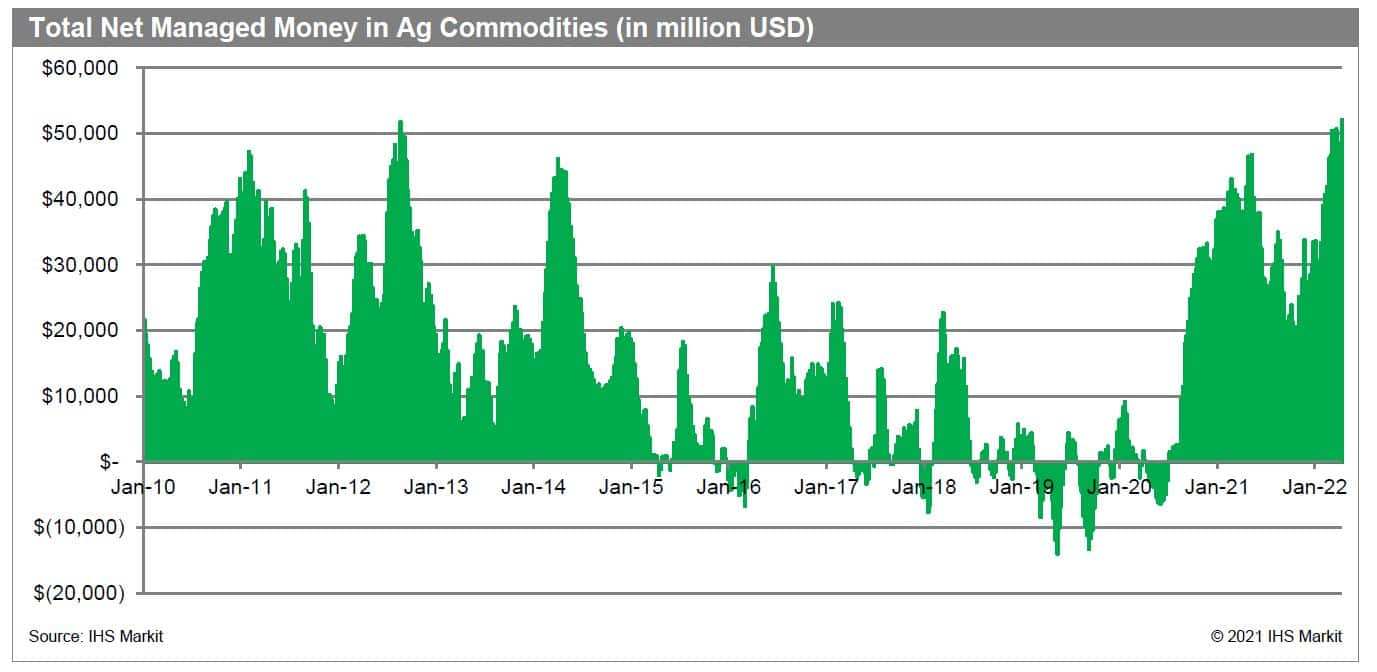 This $52 billion net long position compares to a net short position of $6 billion in mid-2020 and net short $13 billion in late-2019. While the inflow of investment money into ag commodities is not in itself pushing prices higher, it is a contributing factor. It also indicates inflation expectations from pension funds and money managers. Inflation is a particular fear of pension funds that take in a fixed amount of money but will owe future outflows to pensioners indexed to inflation. If inflation goes higher, their future obligations increase. Few asset classes perform as well as commodities in an inflationary environment. The willingness for increased amounts of money to be placed in commodities is a good indicator of increased inflation expectations.
Our collective expectations play a role in many aspects of the economy, but there are few places where that is more true than inflation. Growing inflation expectations can drive behavior, including reducing savings and increasing spending. As one's expectations adjust higher, behavior often changes in a way that stokes inflation. Buying one's bread today and hoarding it in anticipation that prices will trend even higher in the future is just such an example. It increases the demand for bread and wheat, not because of physical need but because the demand for storing and freezing bread has risen. Inflation can be much harder to slow as expectations are adapted to increasing inflation. Clearly, the size of the managed money position indicates an expectation of increasing ag commodity inflation is becoming entrenched. This has and will likely support prices until expectations are adapted lower.
Posted 21 April 2022 by Mr. Hughes Paul, Executive Director, Research and Analysis
This article was published by S&P Global Energy and not by S&P Global Ratings, which is a separately managed division of S&P Global.