


30 Dec 2020 | 11:05 UTC — Insight Blog
Commodity markets in 2020: a year in 9 infographics

Featuring Staff and Eric Yep
The fast pace of events in 2020 left commodity markets—and everyone else—scrabbling for information to make sense of unpredictable times. Throughout the year, S&P Global Platts editors, analysts and data visualization experts used infographics to help clarify complex and shifting issues. Here are just a few, charting a year of disruption and volatility in essential raw materials, energy and shipping—click images to enlarge and follow links in the text for related features.
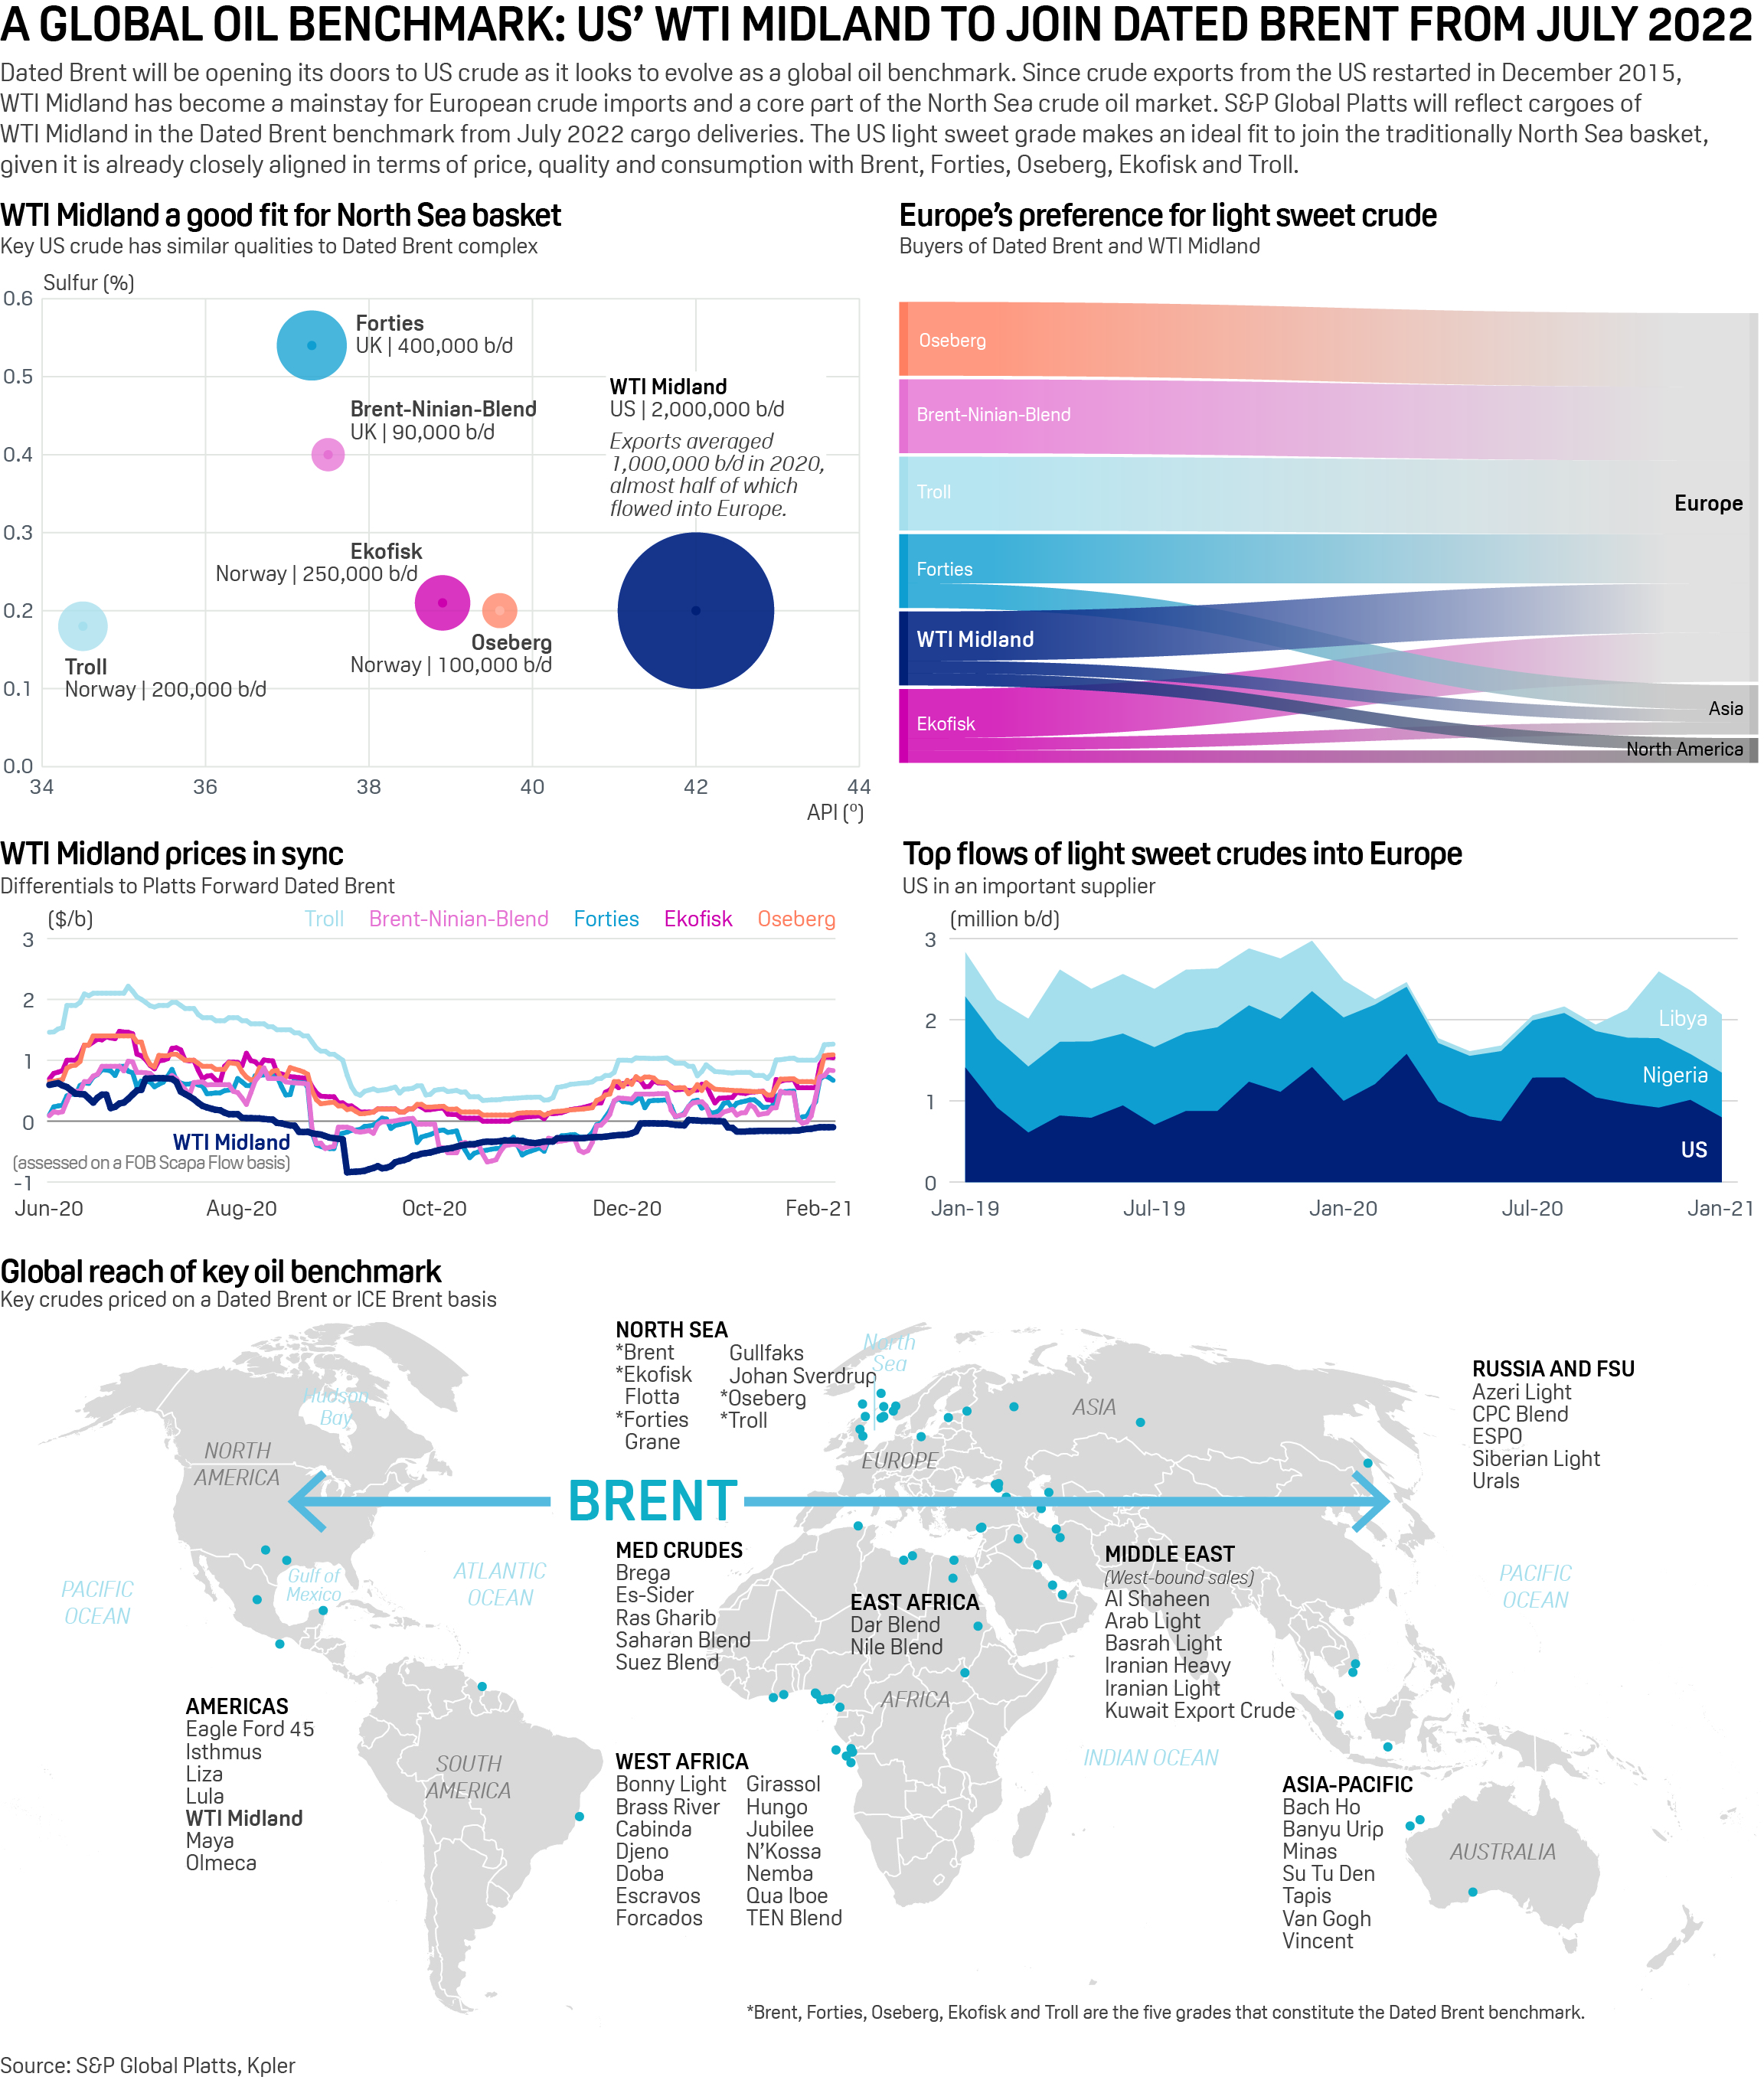
Brent and WTI
December
As WTI crude cements its place in the European crude import slate, S&P Global Platts is consulting with the market to include the US grade in Dated Brent.
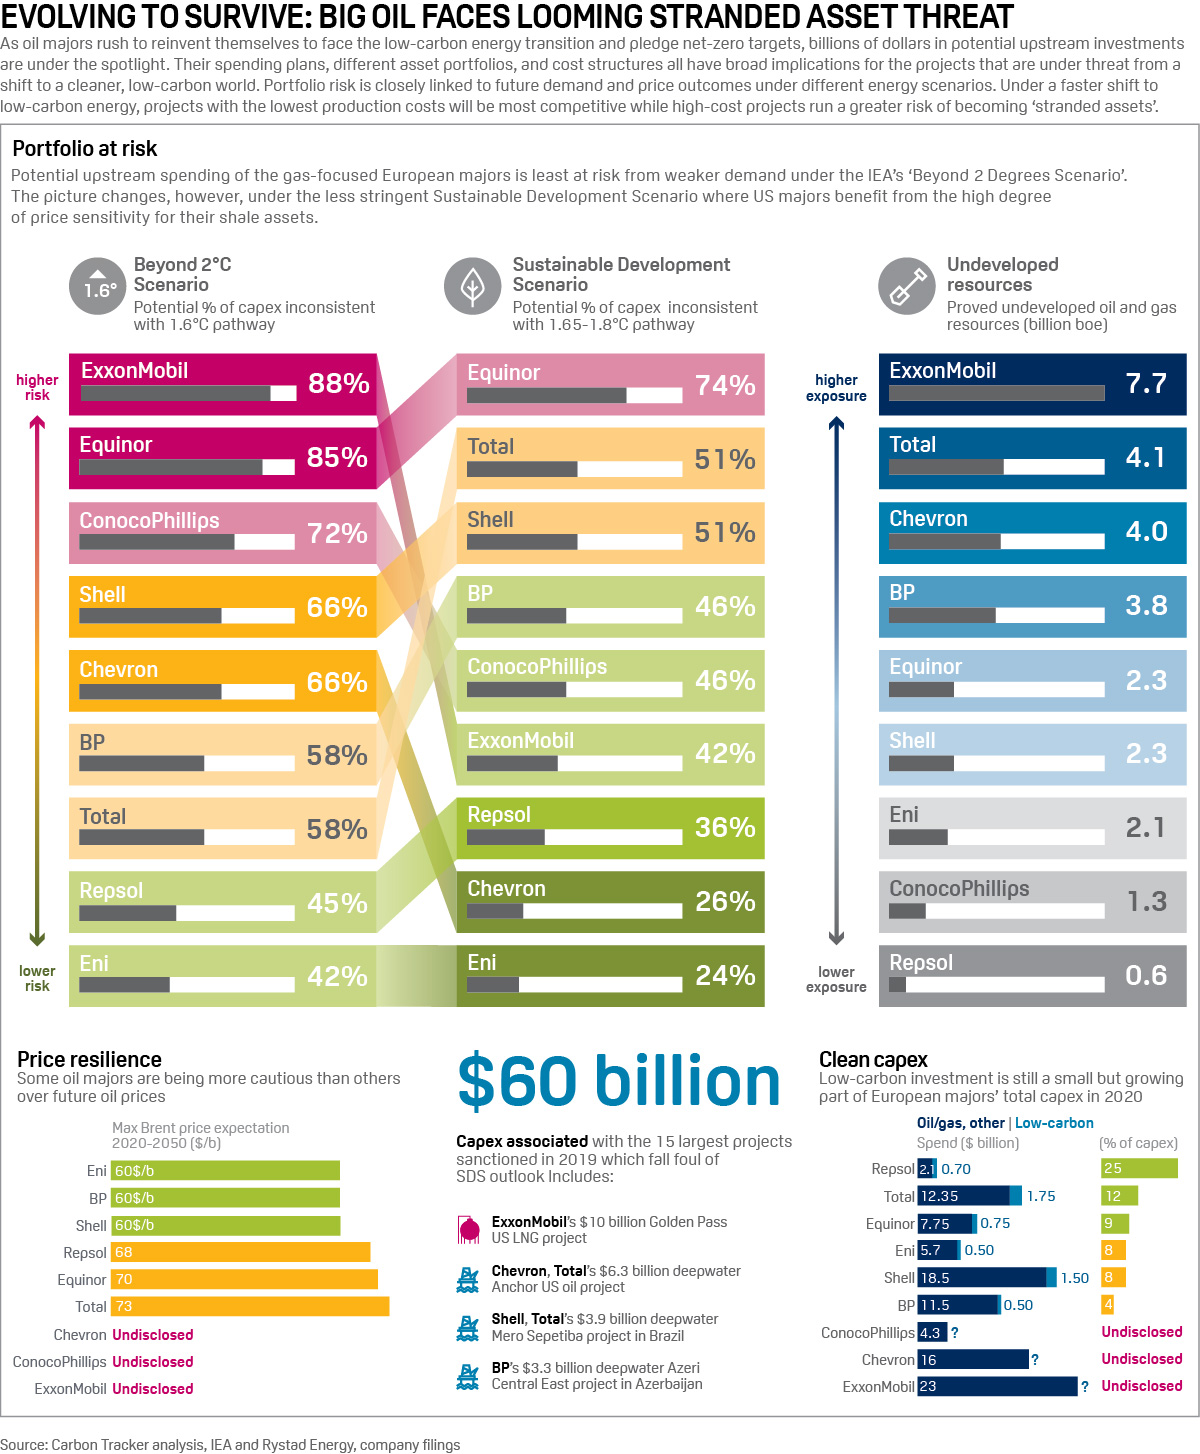
Energy majors grapple with transition
November-December
Global oil majors must urgently adapt strategies for a changing energy system. S&P Global Platts considered the evolution of their upstream risk and the extent of inroads into the power and renewables space.

Go deeper: Browse the full infographics archive
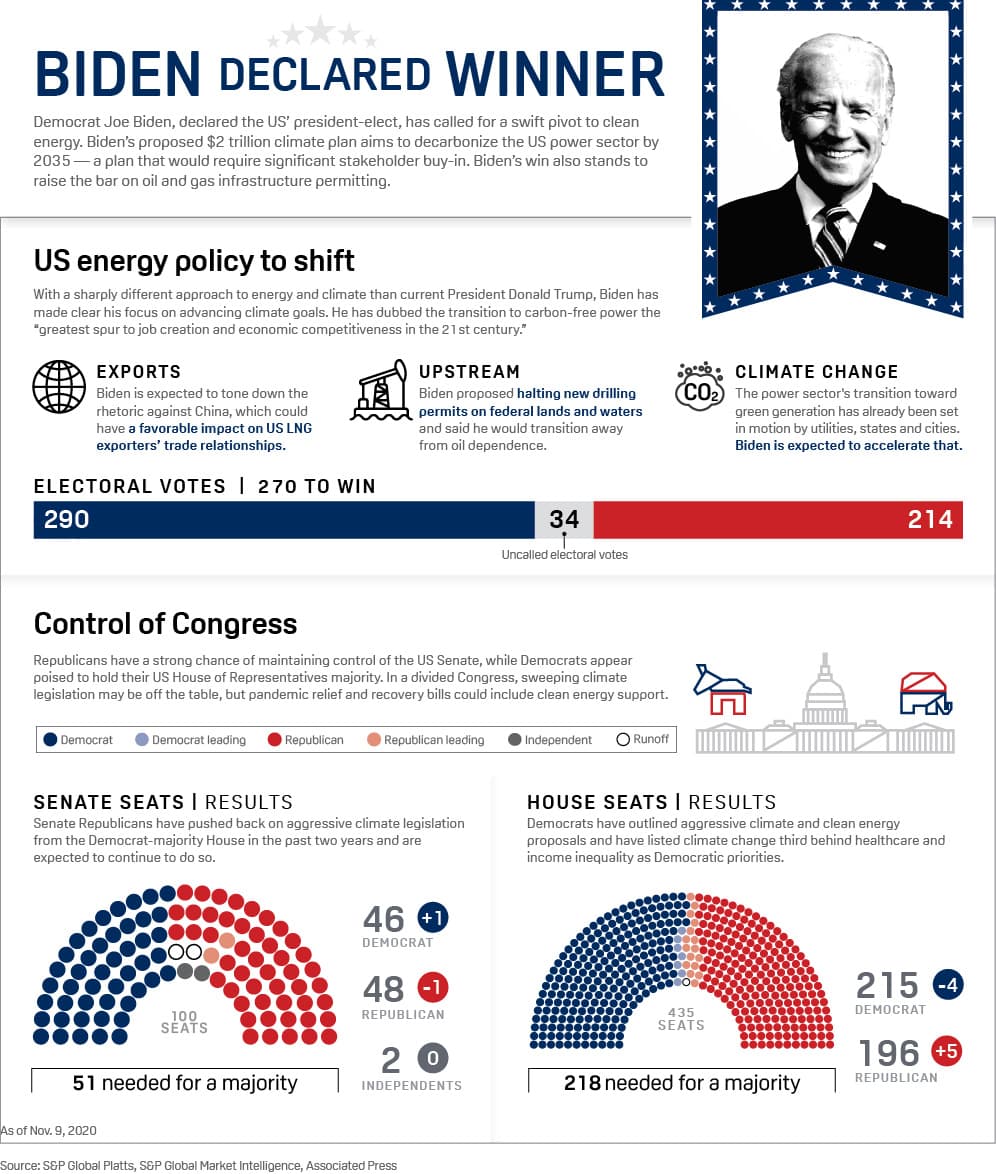
US presidential election and oil policy
November
The presidential candidates put forward contrasting energy policy platforms, and Joe Biden's win represents a shift towards a proactive climate strategy, including more clean energy.
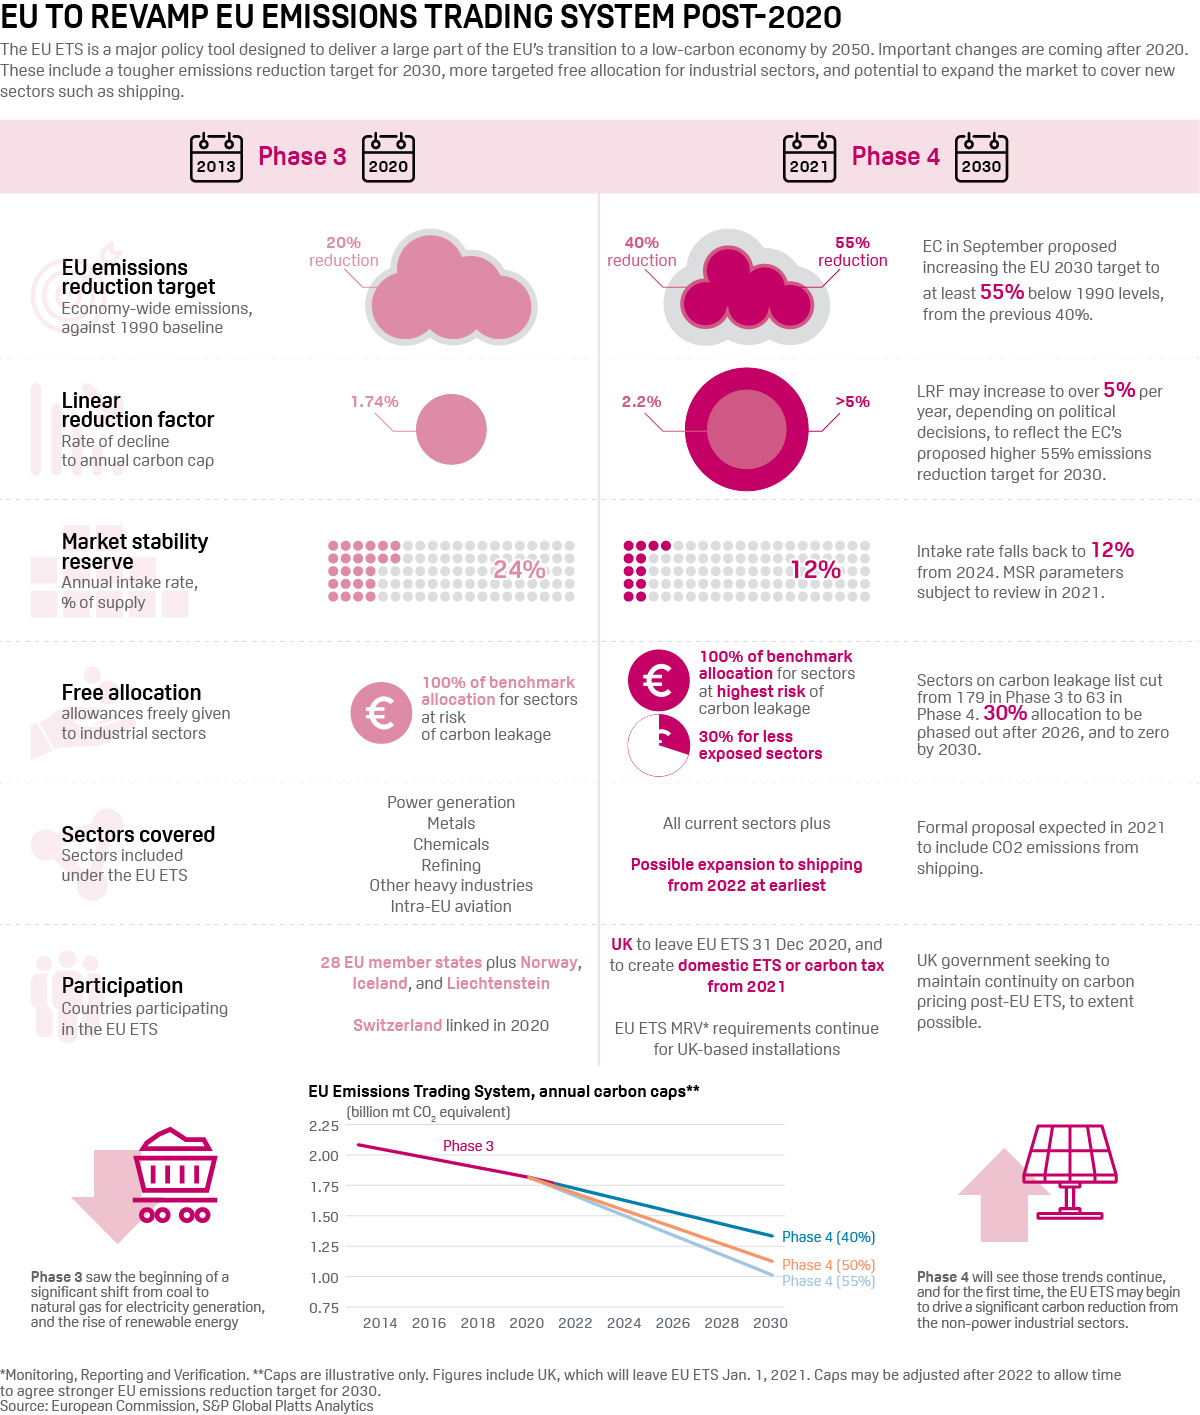
EU revamps Emissions Trading Scheme
October
Big changes are coming up in the EU ETS, a core component of the bloc's strategy to transition to a low-carbon economy.
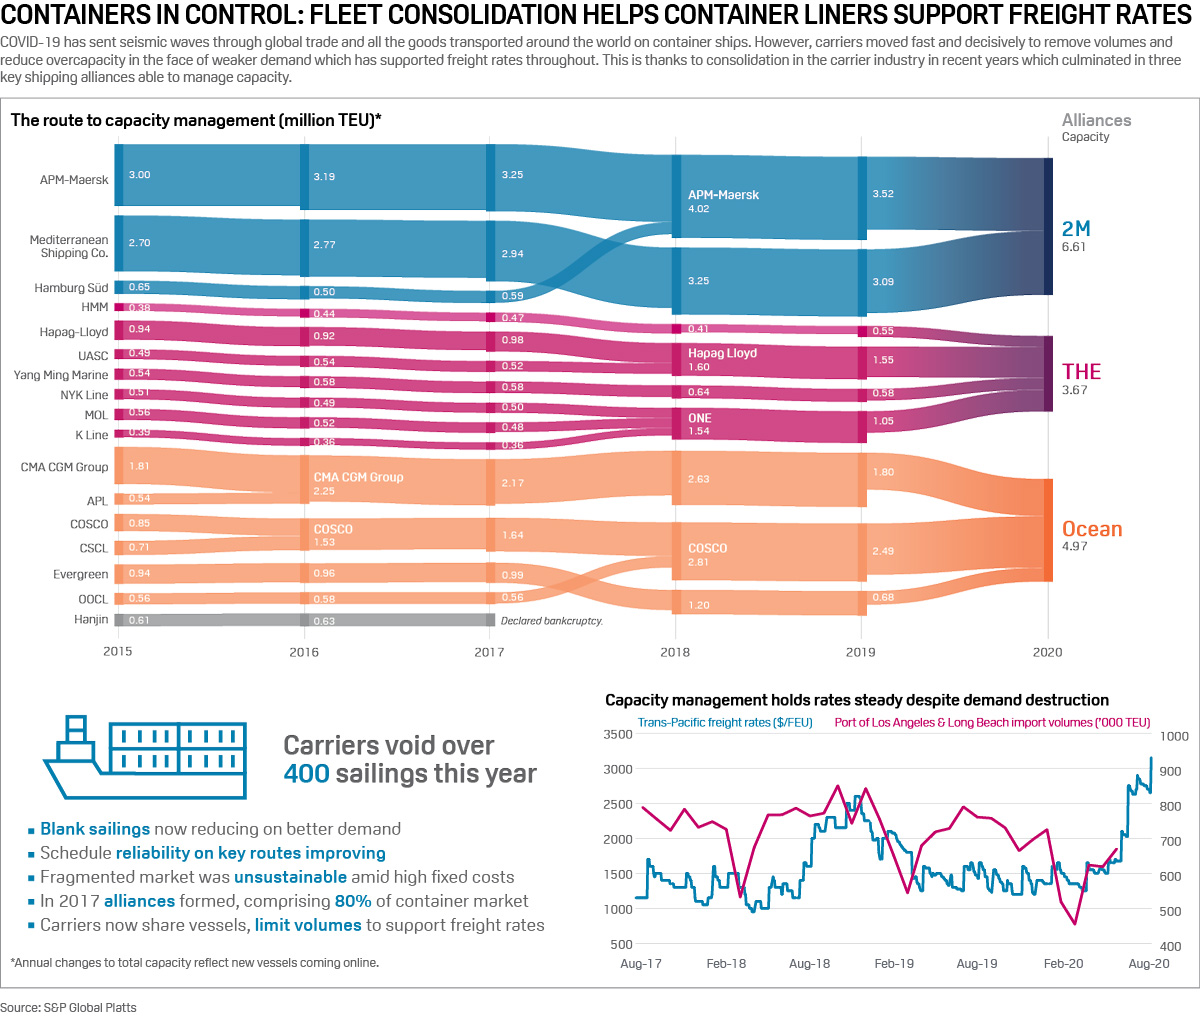
Alliances help containers weather COVID storm
September
Supported freight rates this year suggested the container shipping sector got its market management strategy right.
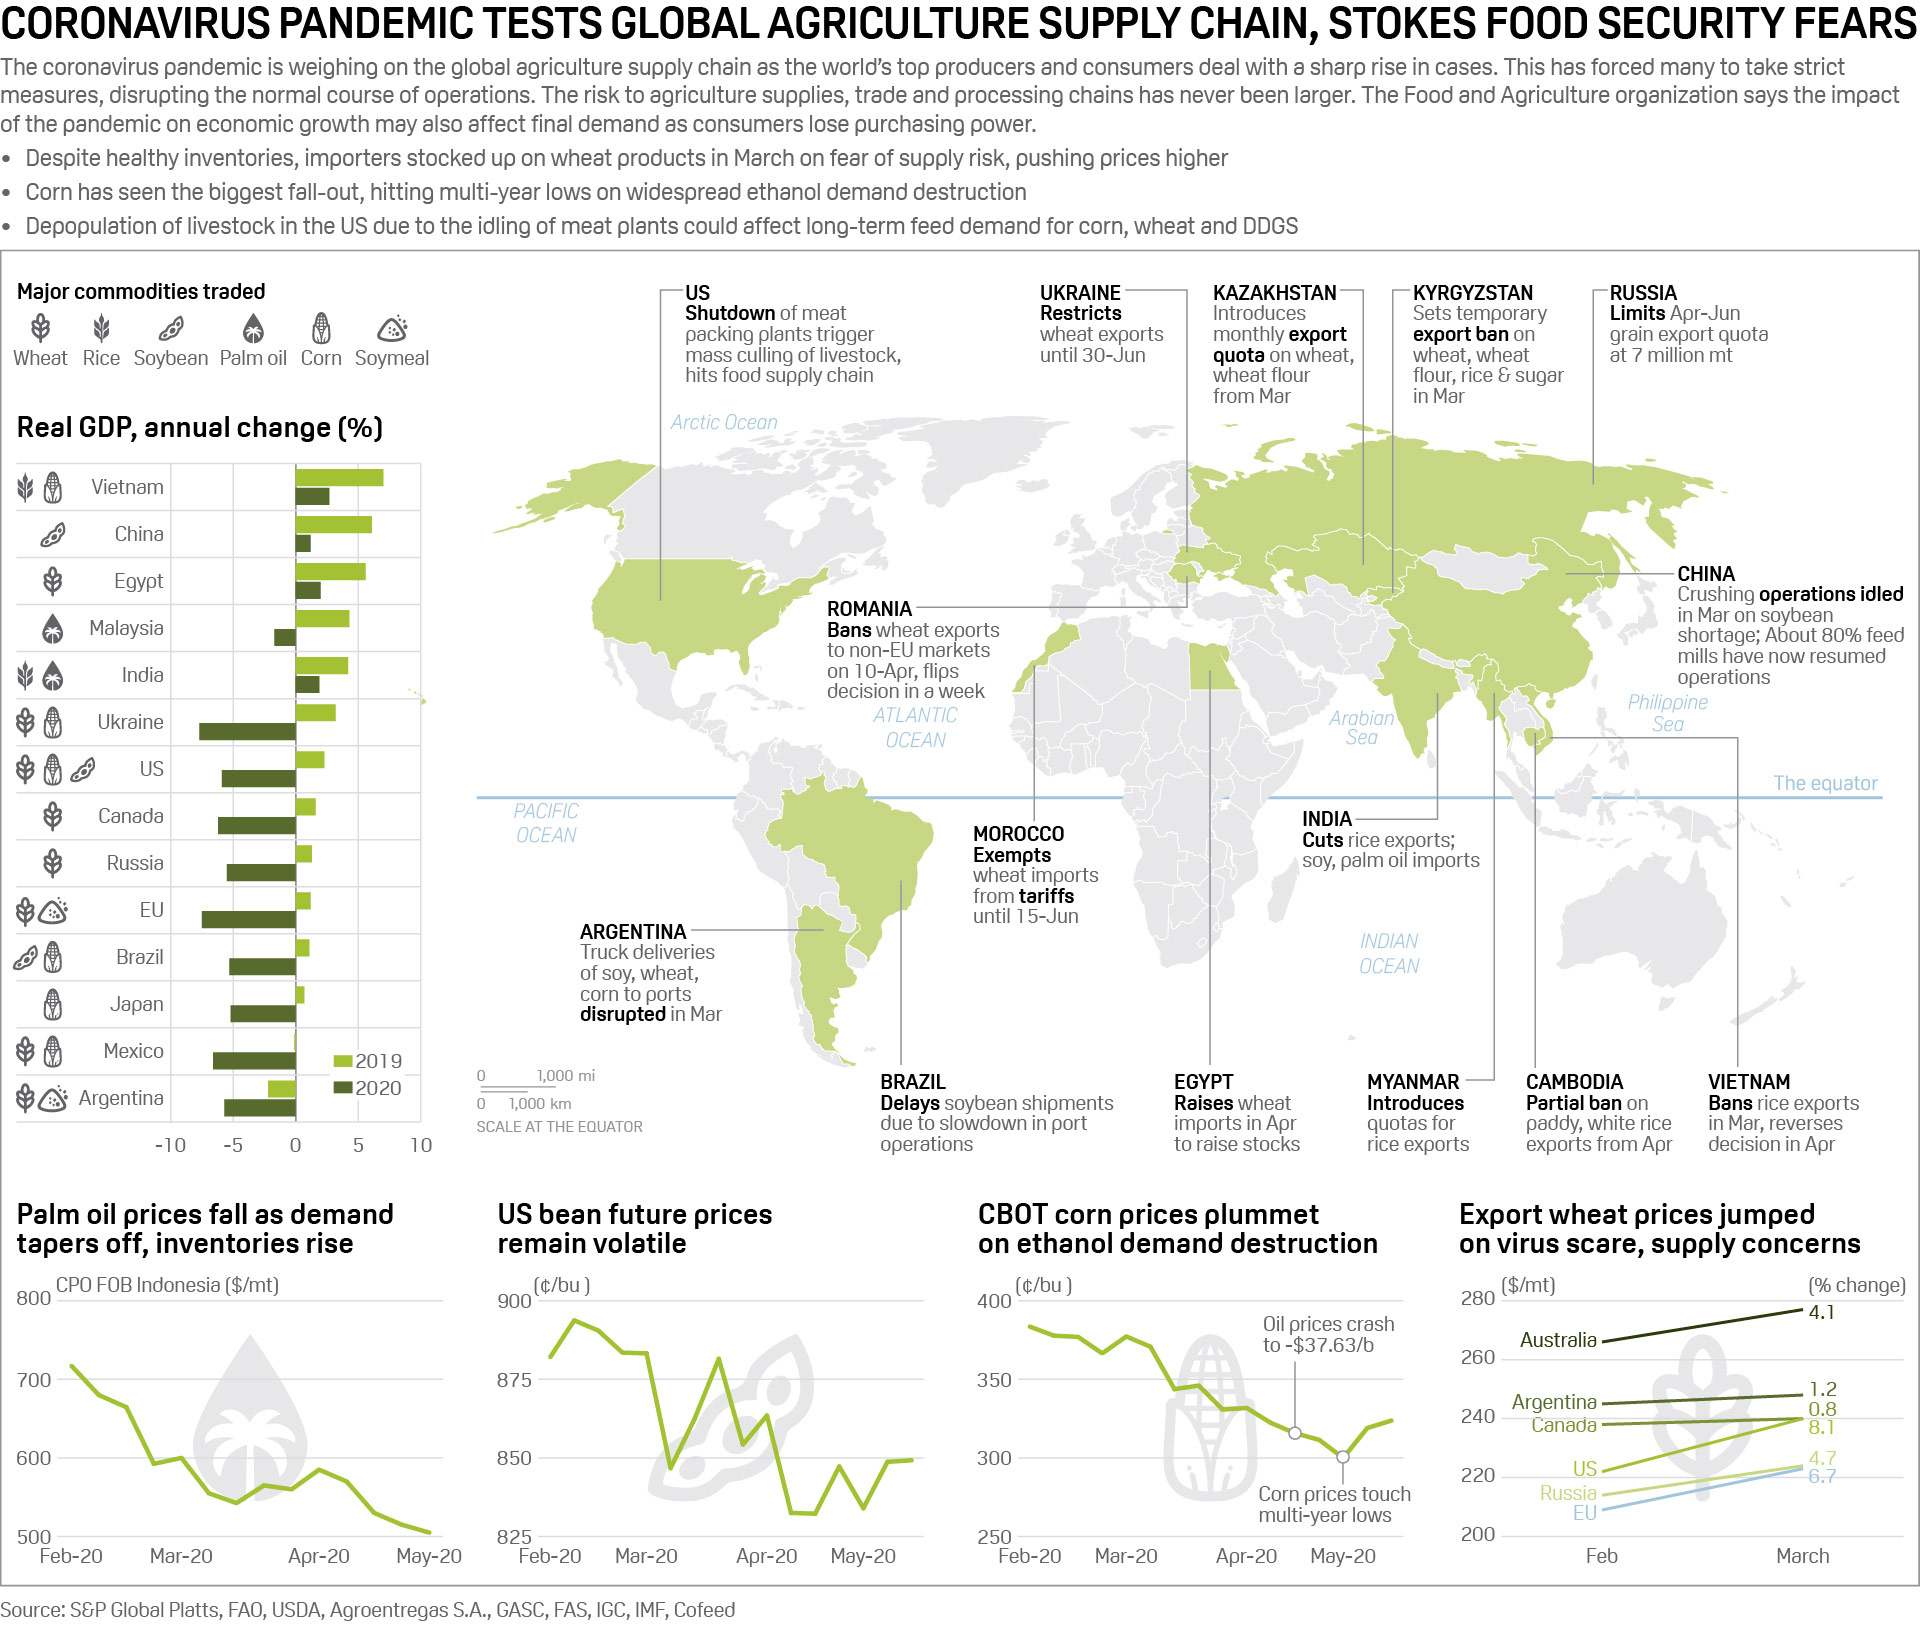
Food security fears hit agriculture supply chains
May
The risks posed by the coronavirus pandemic to the global agriculture supply chain became evident early in the year, as shutdowns, delays and disruptions became the norm.
Go deeper: Browse the full infographics archive
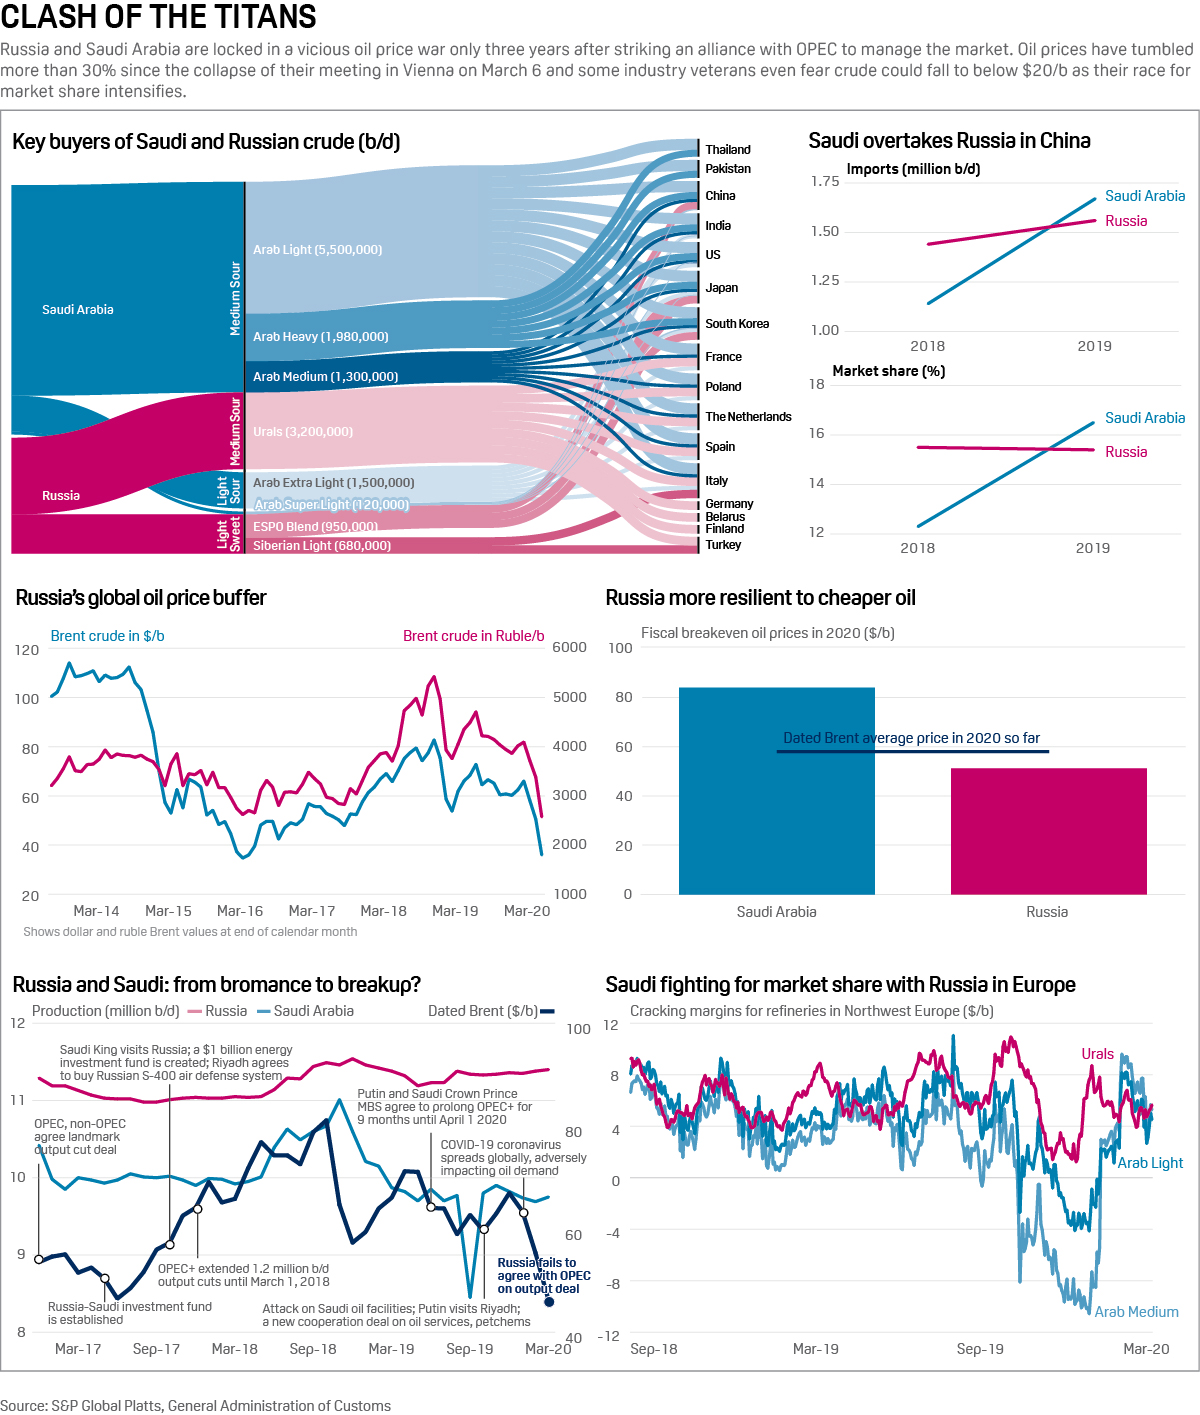
Russia and Saudi Arabia in price war
March
The Russia-Saudi Arabia accord on oil market management collapsed in March, putting crude markets in a tailspin.
Sustainable hydrogen pathways
February
Global planned hydrogen production capacity soared, as companies and national governments looked to harness the gas for decarbonization. Here's an essential guide to production pathways.
